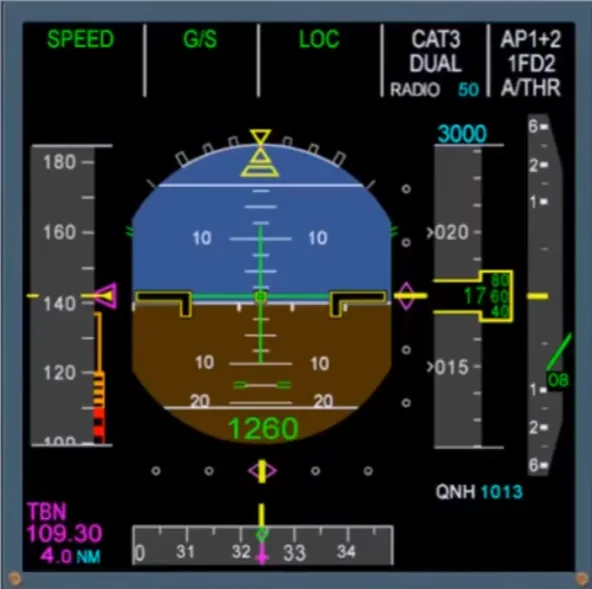
EFIS PFD Presentation
The PFD, displays all the normal primary flight indications:
- Attitude
- Airspeed
- Altitude
- Vertical speed
- Heading and track.
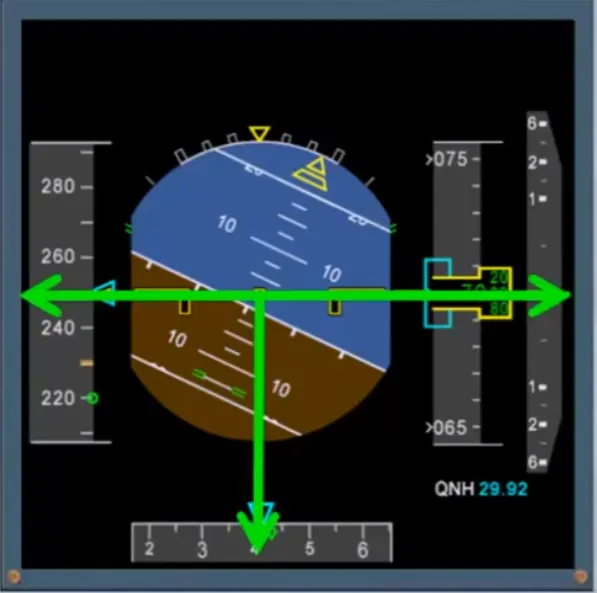
Notice that the yellow reference indicators are laid out in a classic instrument “T” configuration.
The PFD also displays other information.
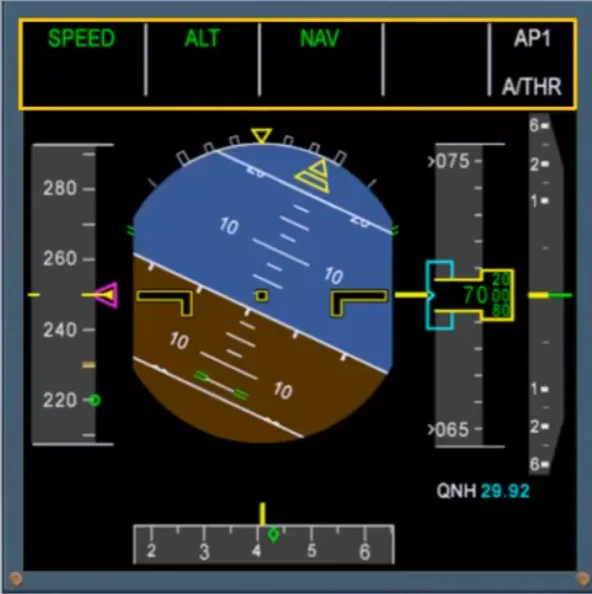
The upper part of the display is used to provide information to the pilots associated with the selected guidance or with the managed guidance.
The area is known as the Flight Mode Annunciator (FMA). You will learn more about the FMA in the autoflight modules.
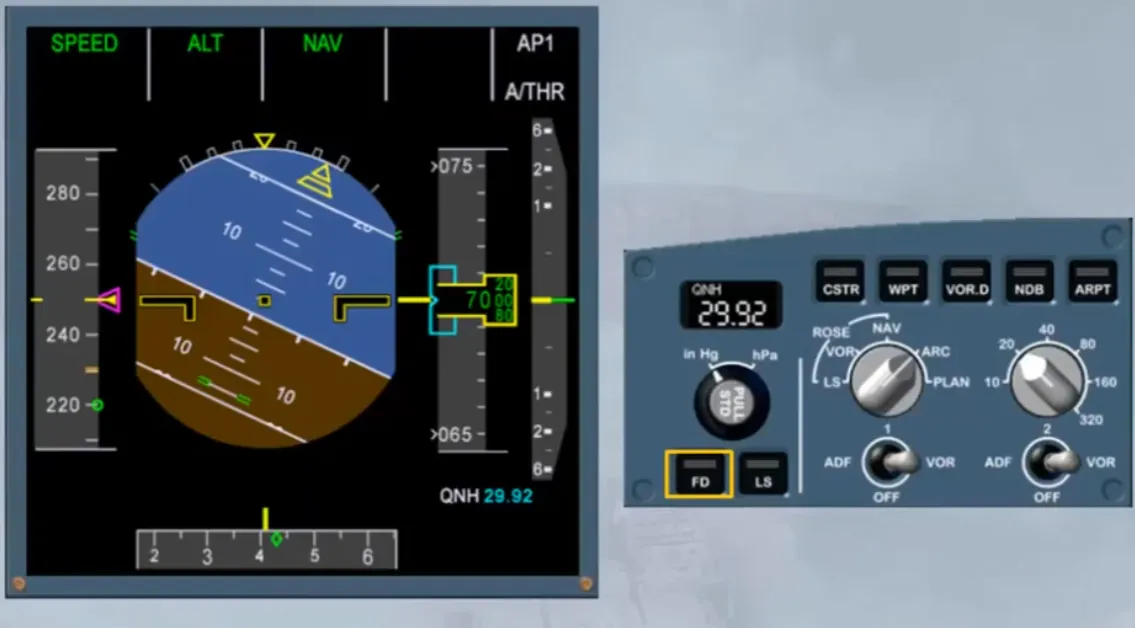
A Flight Director (FD) pb on the EFIS control panel enables the pilots to switch the FD display on.
Notice that there is an indication on the FMA when the FDs are switched on.
Caution: Both FDs must be switched on or both off. You should never fly with only one FD selected on.
When below 2,500 feet a digital radio altimeter is displayed.
In this module, we will concentrate on the primary flight indications.
Let’s start with attitude!
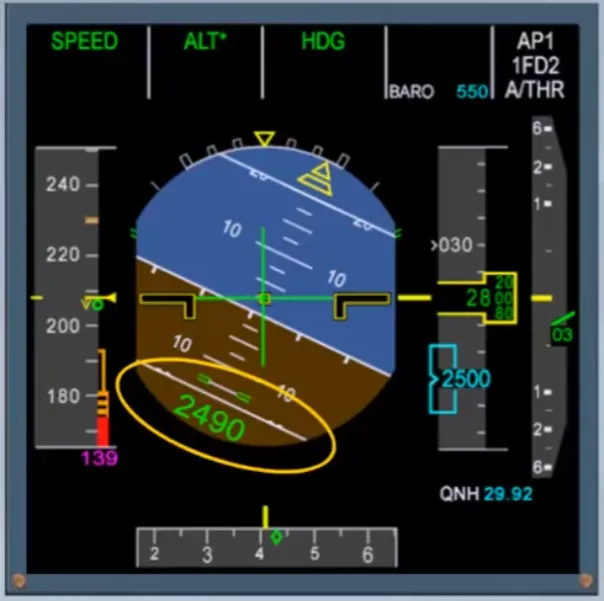
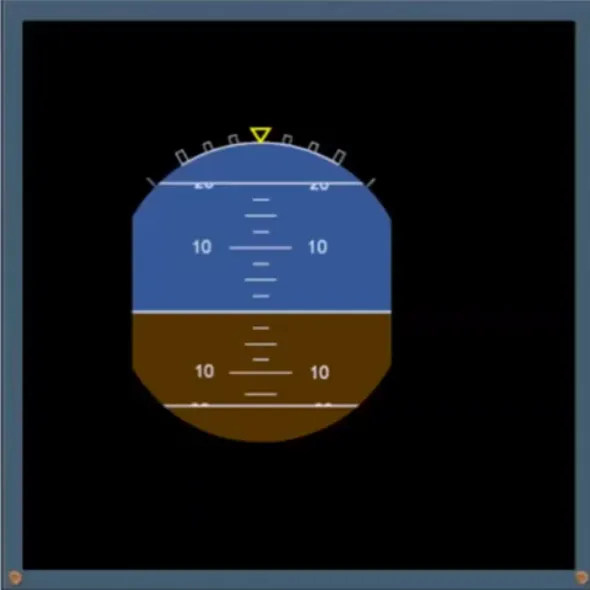
Attitude information is shown at the center of the display. The attitude indicator works in the normal sense. The pitch scale has white markers, as shown.
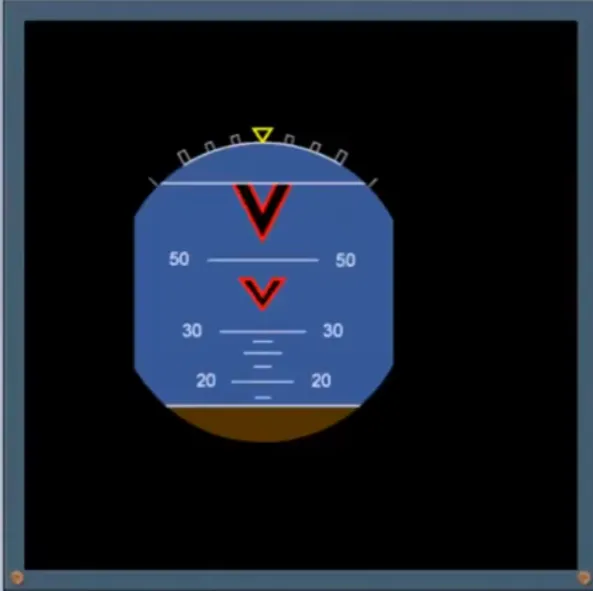
Beyond 30 degrees, large red arrowheads show the direction to move the nose in order to reduce the pitch.
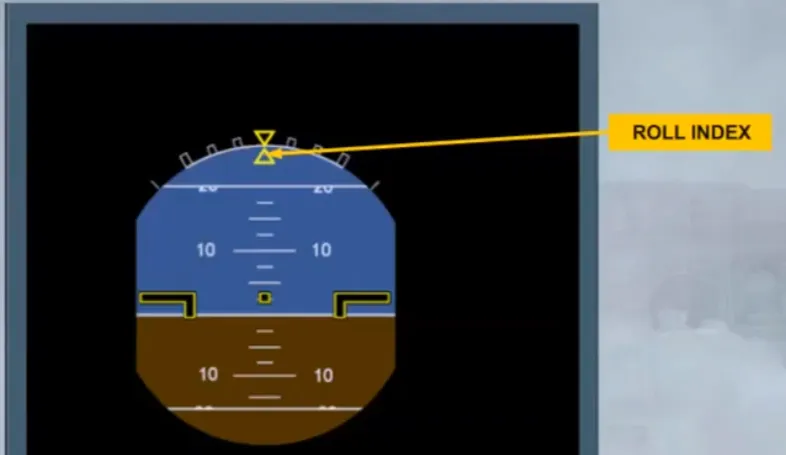
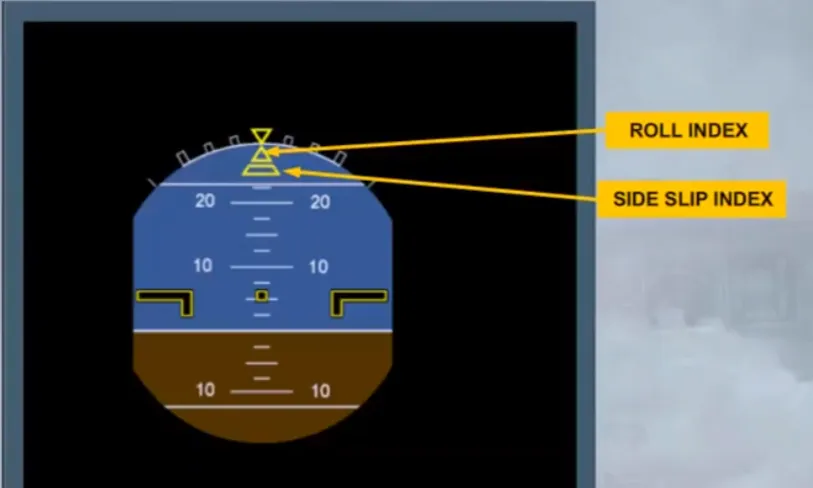
The roll scale is displayed at the top of the indicator, the yellow triangle shows the zero and the white markers indicate 10, 20, 30 and 45 degrees of bank.
The aircraft is represented by a fixed symbol in black and outlined in yellow.
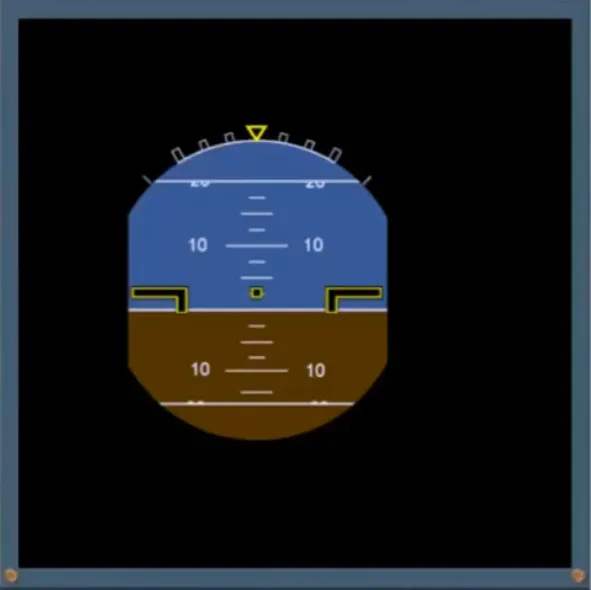
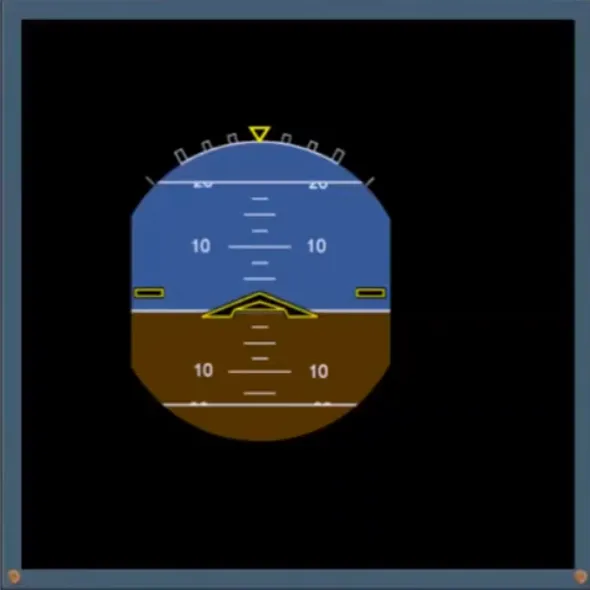
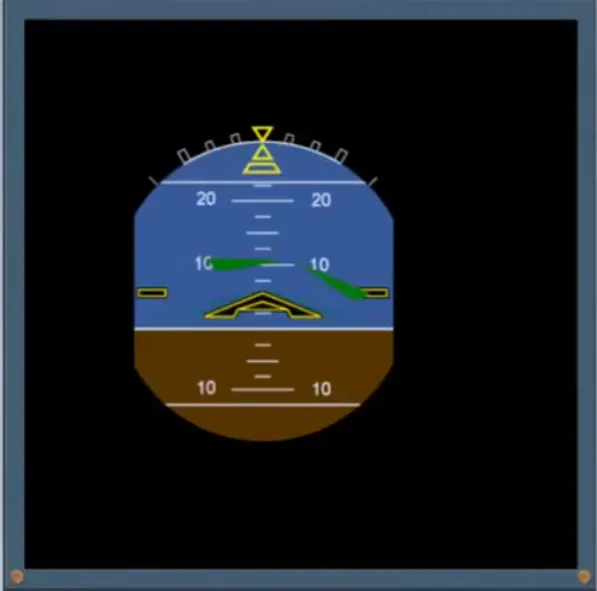
Note: If V bars option is installed the aircraft symbol is as shown.
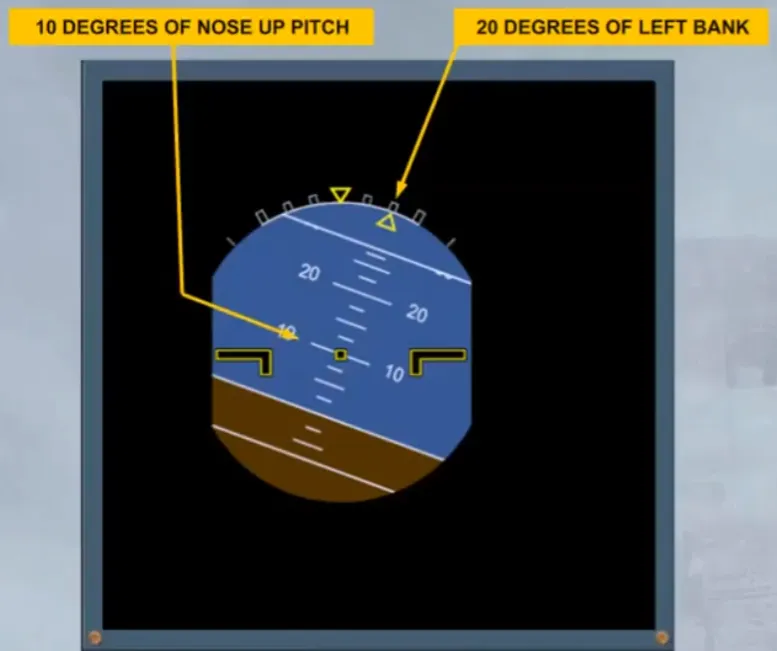
The roll index triangle moves against the white fixed scale, showing the current bank angle.
In this example the aircraft is in a 20 degrees banked turn to the left with a nose up pitch attitude of 10 degrees.
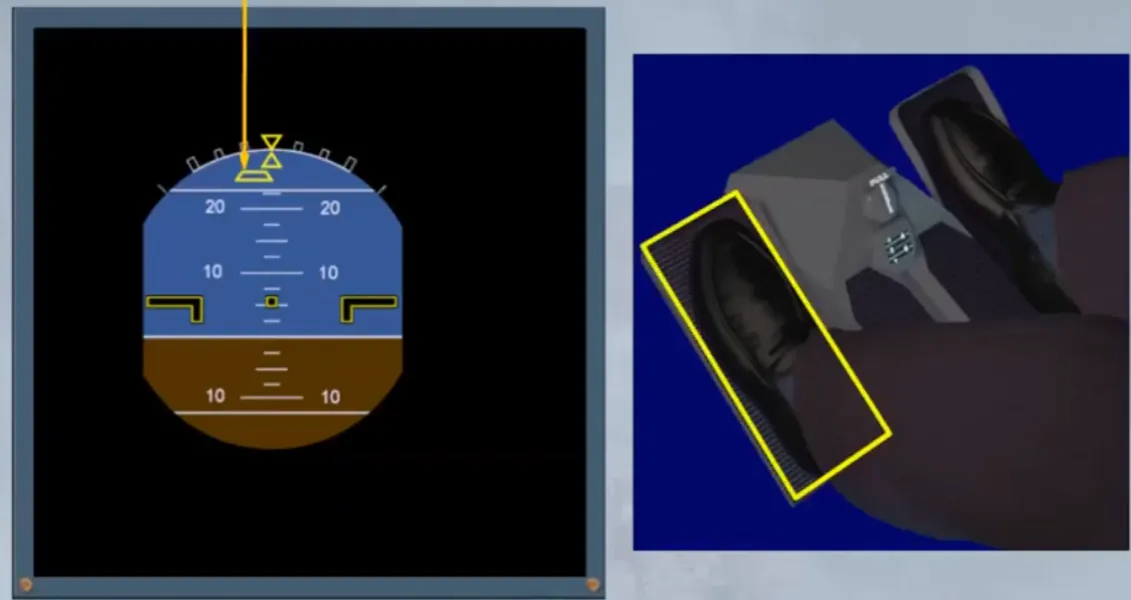
Below the roll index is the side slip index. This index moves to indicate lateral acceleration on ground and side slip, in flight. It replaces the old fashioned slip ball.
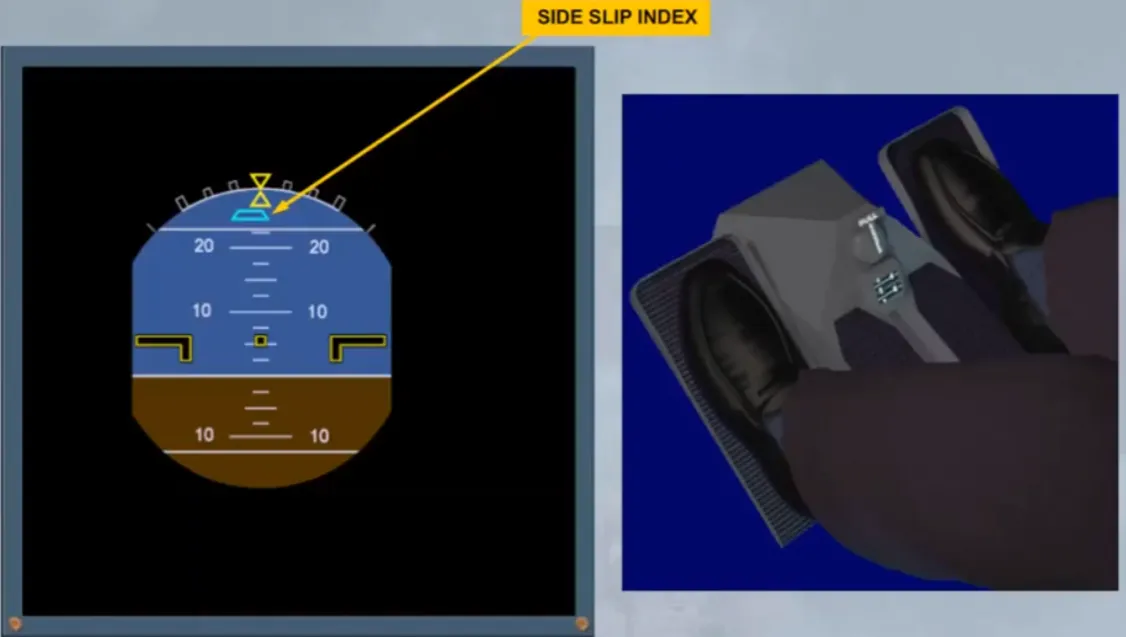
When this index is centered with the roll index, the side slip equals the side slip target for optimum aircraft performance.
The PF must use pedals to reduce side slip to zero:
- If the base of the pyramid is to the left, use your left foot to center the pyramid
- If the base of the pyramid is to the right, use your right foot to center it.
If an engine failure occurs in takeoff or go around configuration, the side slip index changes from yellow to blue and is called β target.
For more information, refer to the ATA 27: NORMAL LAW and PROTECTIONS module.
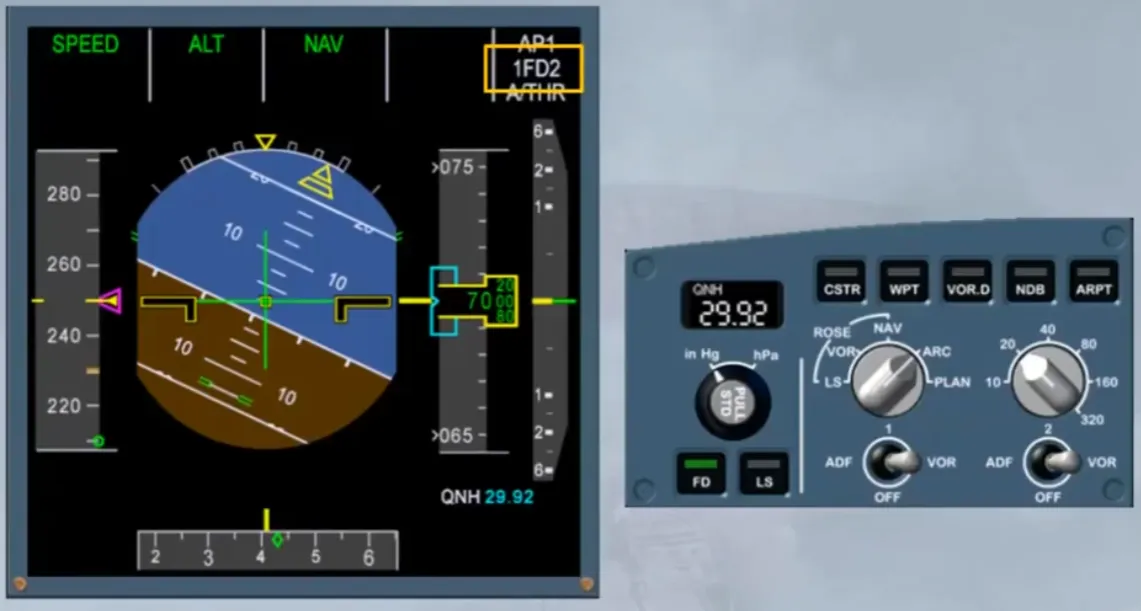
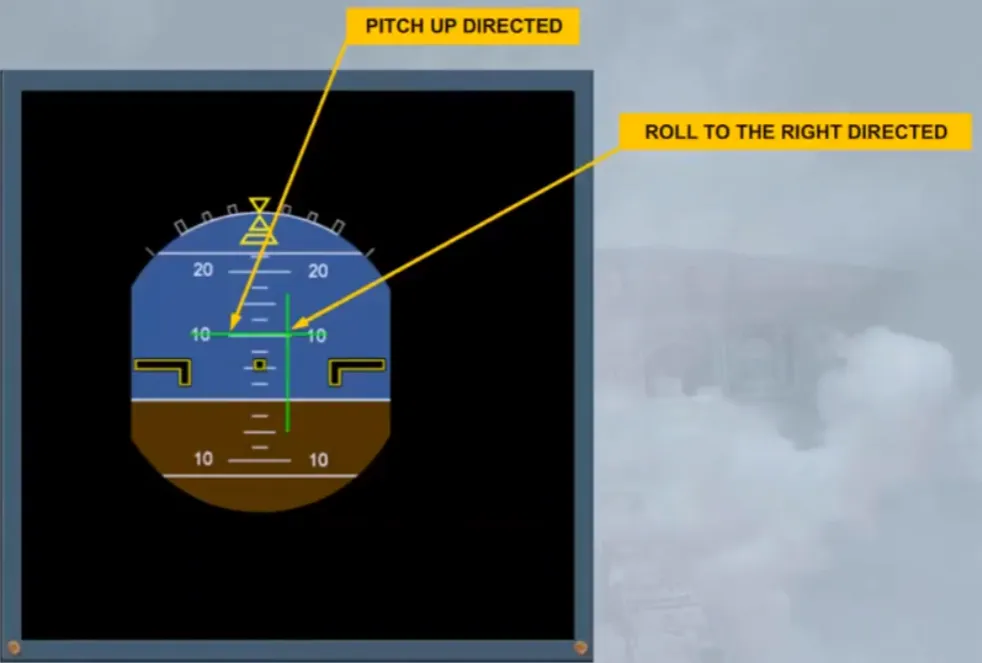
When the Flight Director (FD) pb on the EFIS control panel is selected, FD indications are superimposed onto the attitude indicator.
The vertical line is the Flight Director roll bar, while the horizontal line is the pitch bar.
Let’s look at an example of the FD in use.
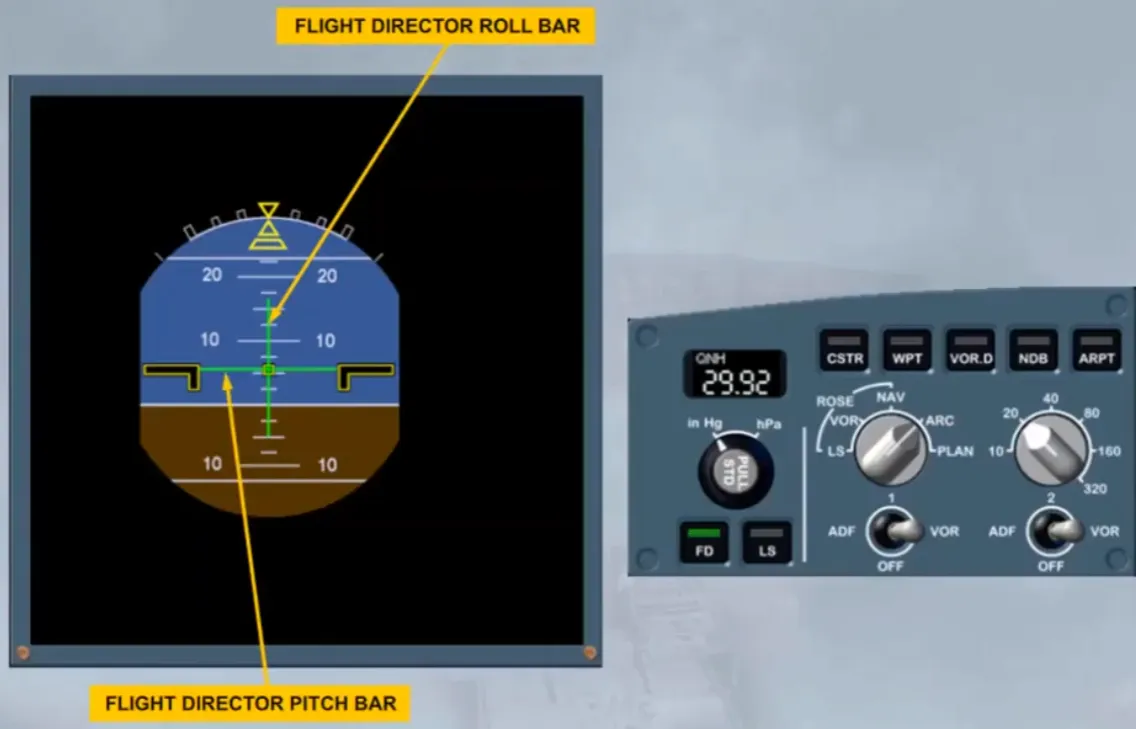
In this example the FD is directing a pitch up and roll to the right. Once the aircraft has achieved the required pitch and bank, the FD bars will once again be centered.
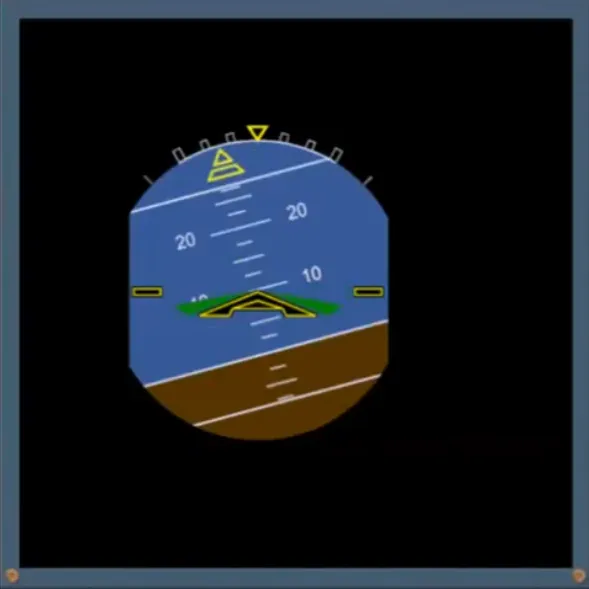
Note: if V bars option is installed, the pitch and roll indications will be as shown.
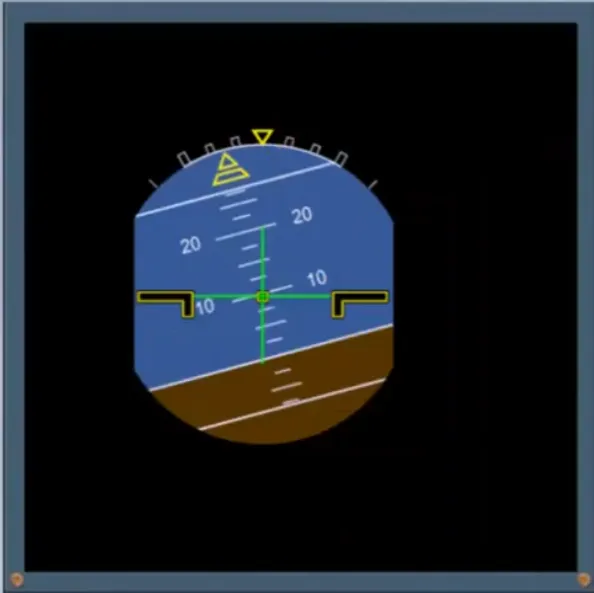
Also, after starting the first engine a white cross shows the sum of sidesticks orders, and white corners show the max deflection limits.
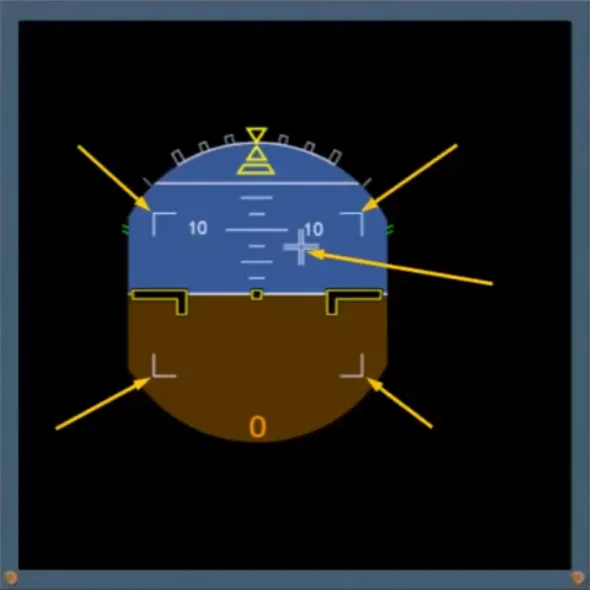
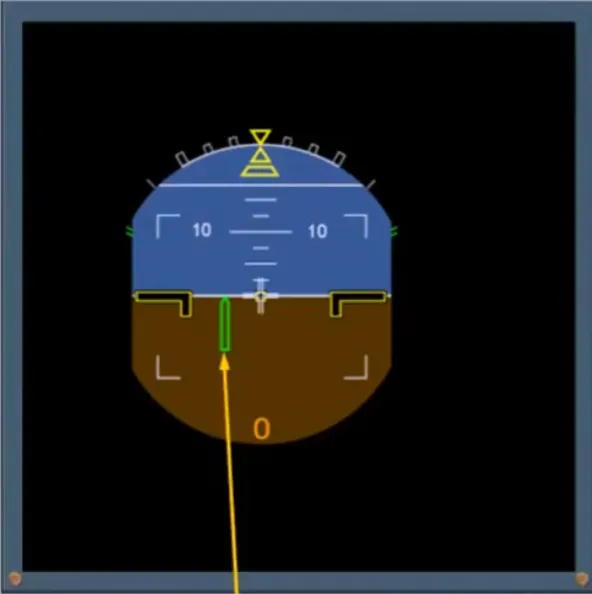
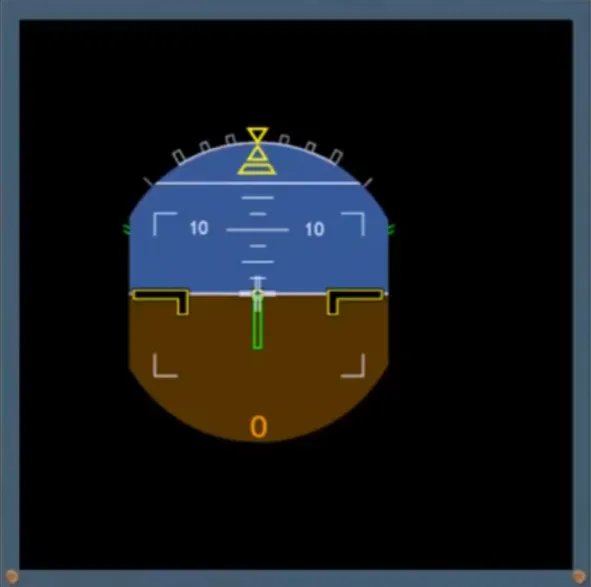
Also, when on ground or below 30 feet RA, a ground roll guidance command bar is displayed, provided a localizer is tuned. It shows the flight director yaw orders to keep the runway centerline.
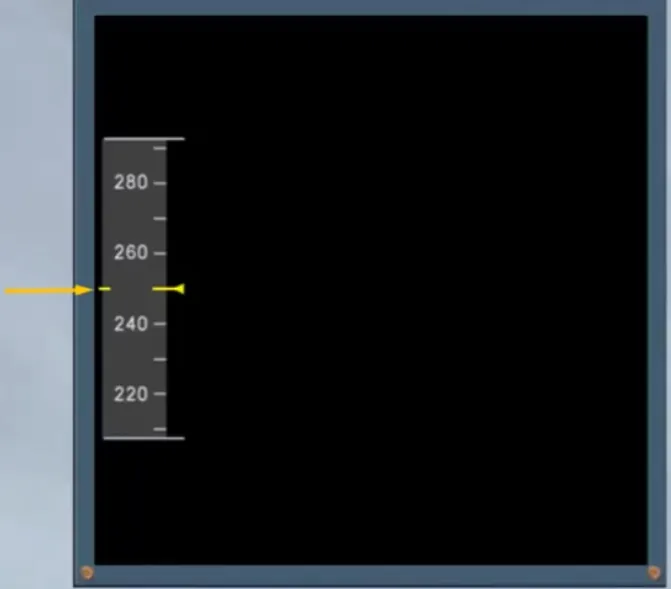
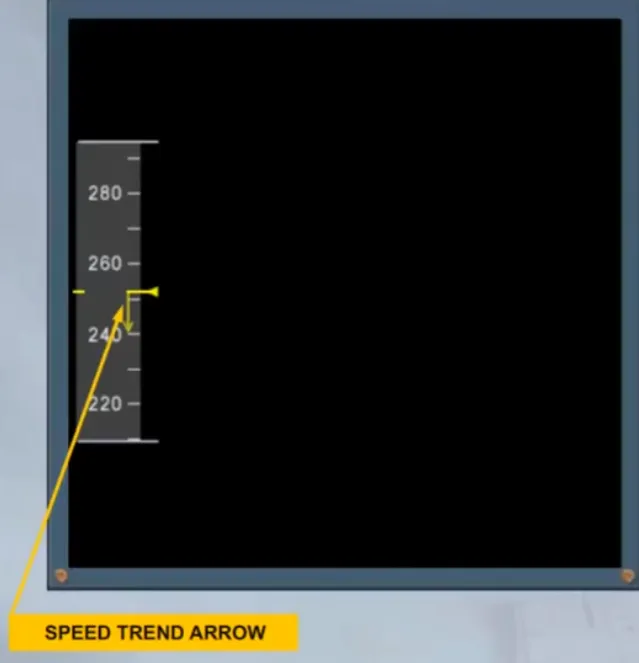
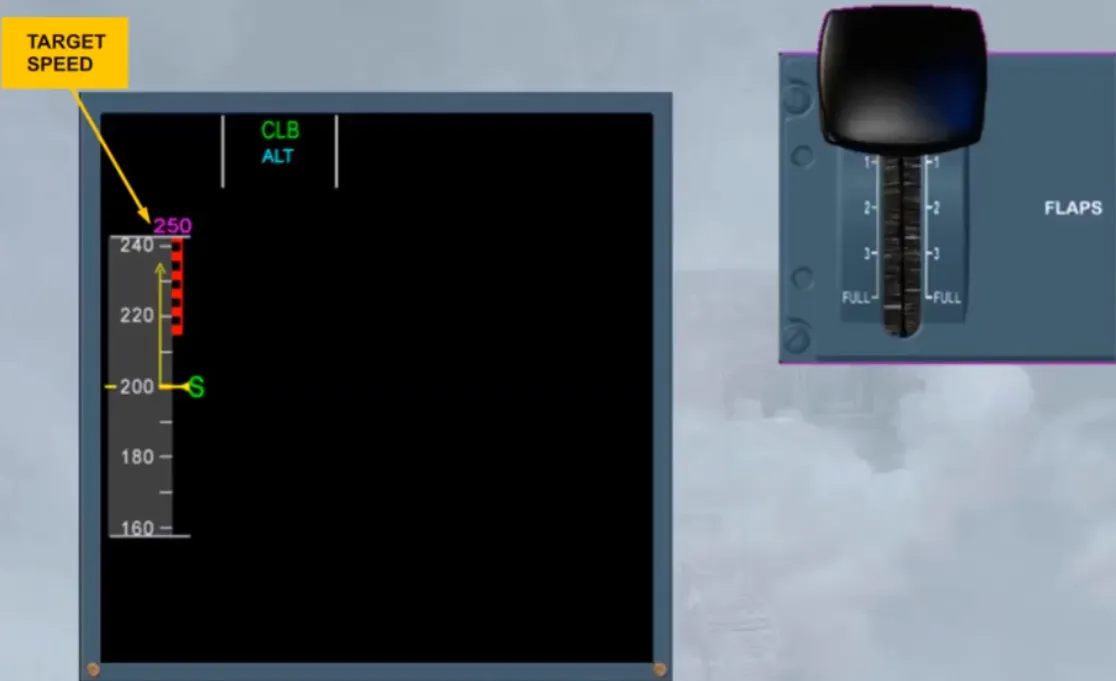
The speed scale moves behind a fixed yellow reference line and triangle.
In the example shown, the indicated airspeed has stabilized at 250 knots.
When the aircraft is accelerating, or decelerating a speed trend arrow appears.
This arrow shows the value that will be attained in 10 seconds, if the acceleration remains constant.
In the example shown, the aircraft will decelerate to 240 knots in 10 seconds. The use of the speed trend arrow will be demonstrated during your simulator training.
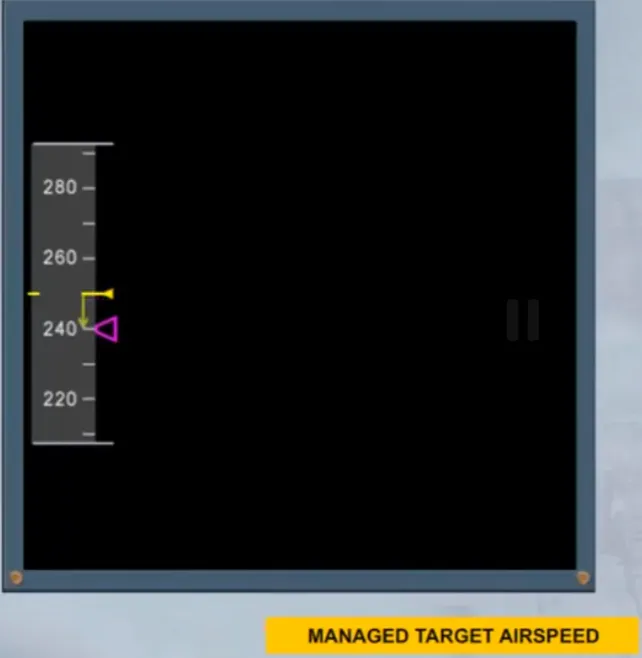
When the Flight Management and Guidance System(FMGS), is controlling the airspeed, a magenta target airspeed triangle appears.
This is normally referred to as the managed speed.
In the example shown, the managed target airspeed is 240 knots and the aircraft is decelerating towards that speed.
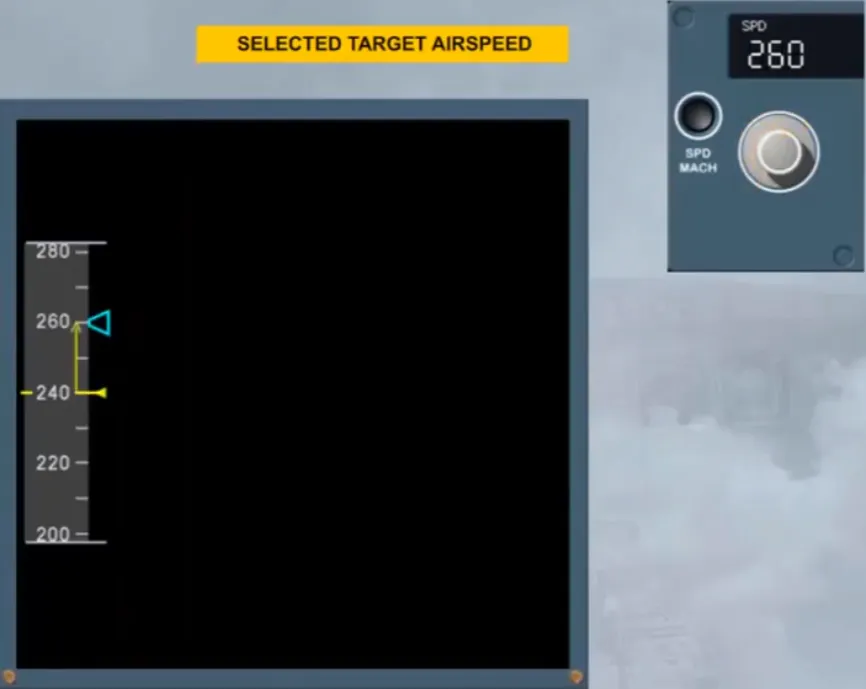
If the target airspeed is selected manually a blue triangle appears. This is normally referred to as selected speed.
In the example shown, a selected airspeed of 260 knots has been set and the aircraft is accelerating towards it.
To look at the various other indications on the airspeed scale, we will run through a typical flight profile. We will assume a departure with the flaps in position 2. You will learn about the various flap and slat configurations in the flight control modules.
On the MCDU PERF TAKE OFF page, the crew inserts V1, VR and V2.
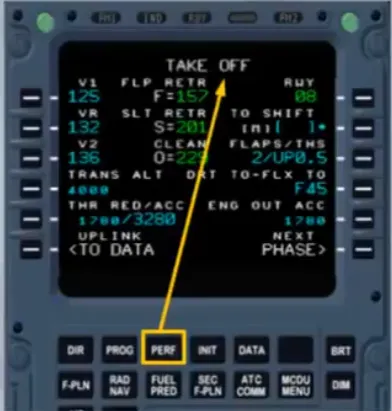
The upper part of the speedscale shows V1 in blue numbers and V2 in magenta numbers as long as they are off the scale.
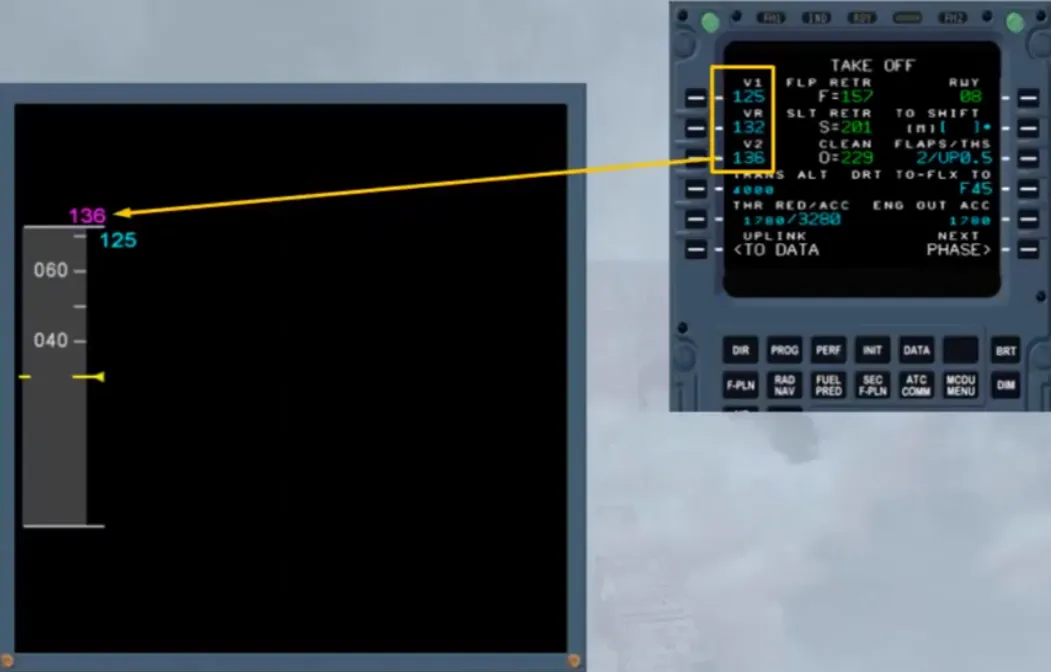
Notice the related indications, when V1, VR and V2 are visible on the scale.

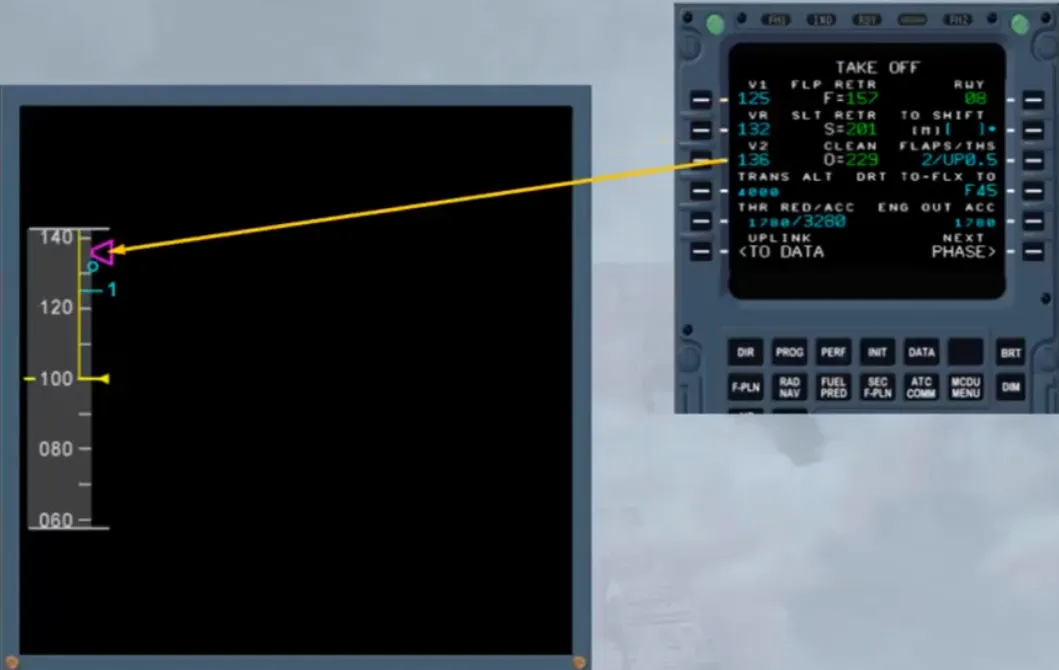
The PNF announces “V1”.
Then, at VR the lift off must be performed.
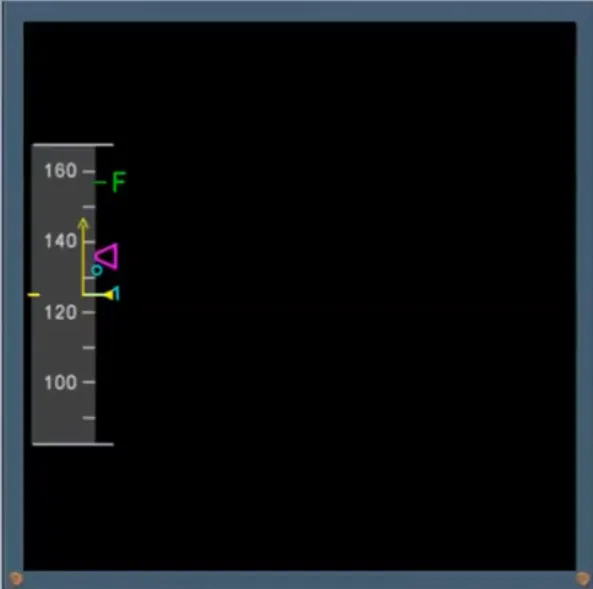
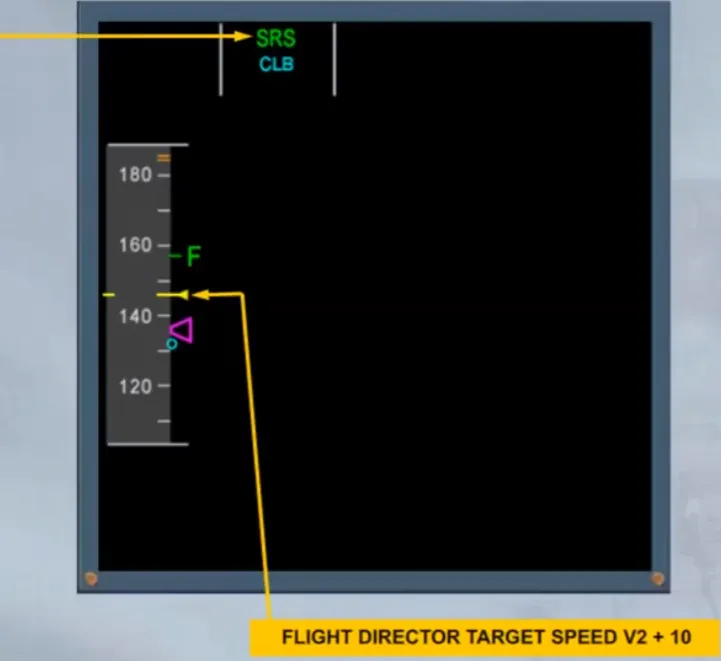
After lift off the speed stabilizes at V2+10, because that speed is the flight director reference in SRS mode as shown on the FMA.
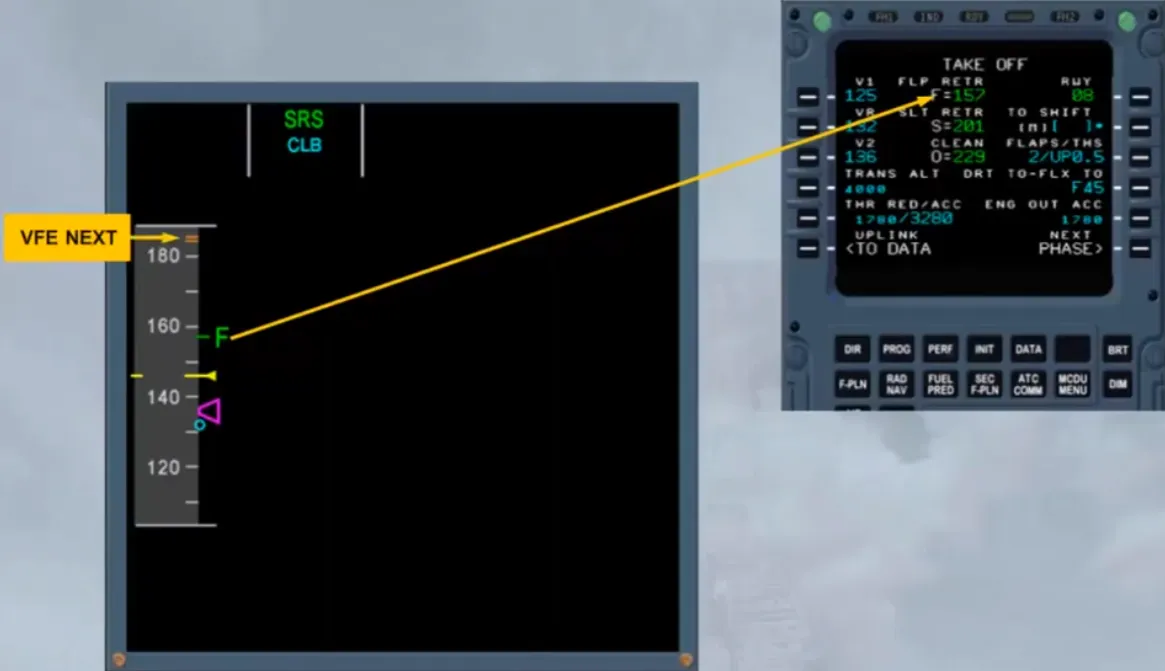
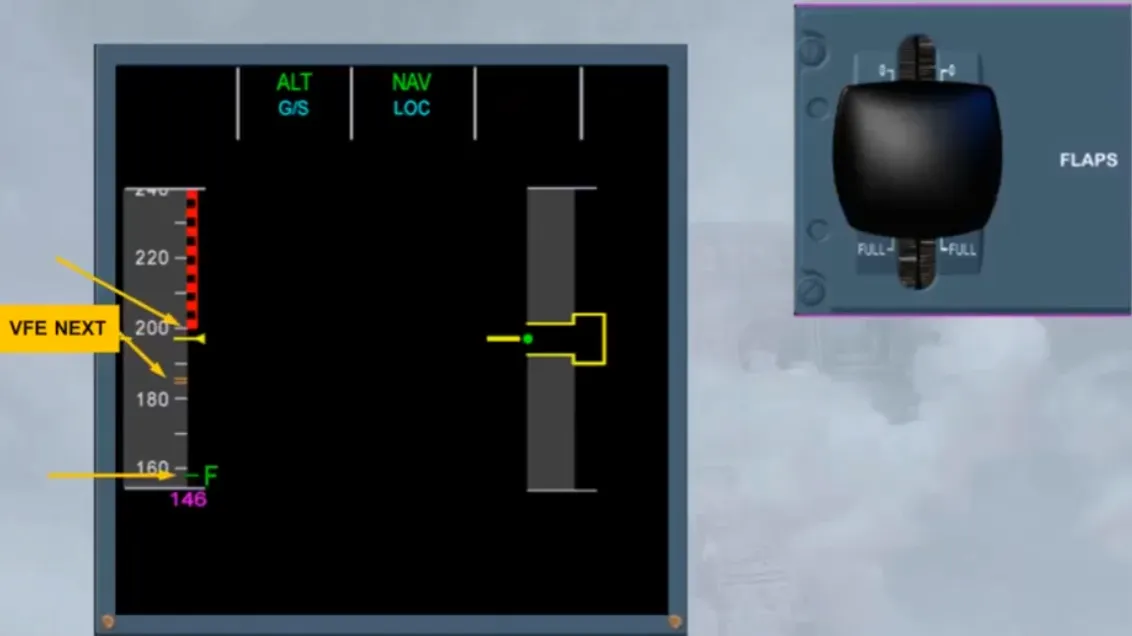
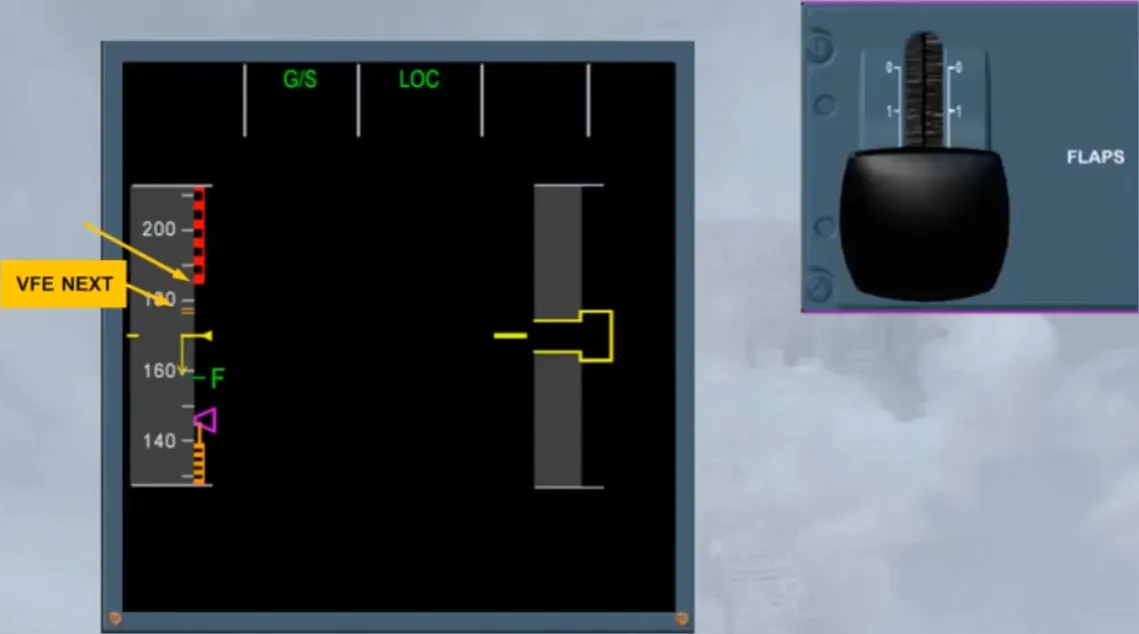
The F symbol corresponding to the computed minimum flap retraction speed and the VFE NEXT appear, because their values are visible on the scale.
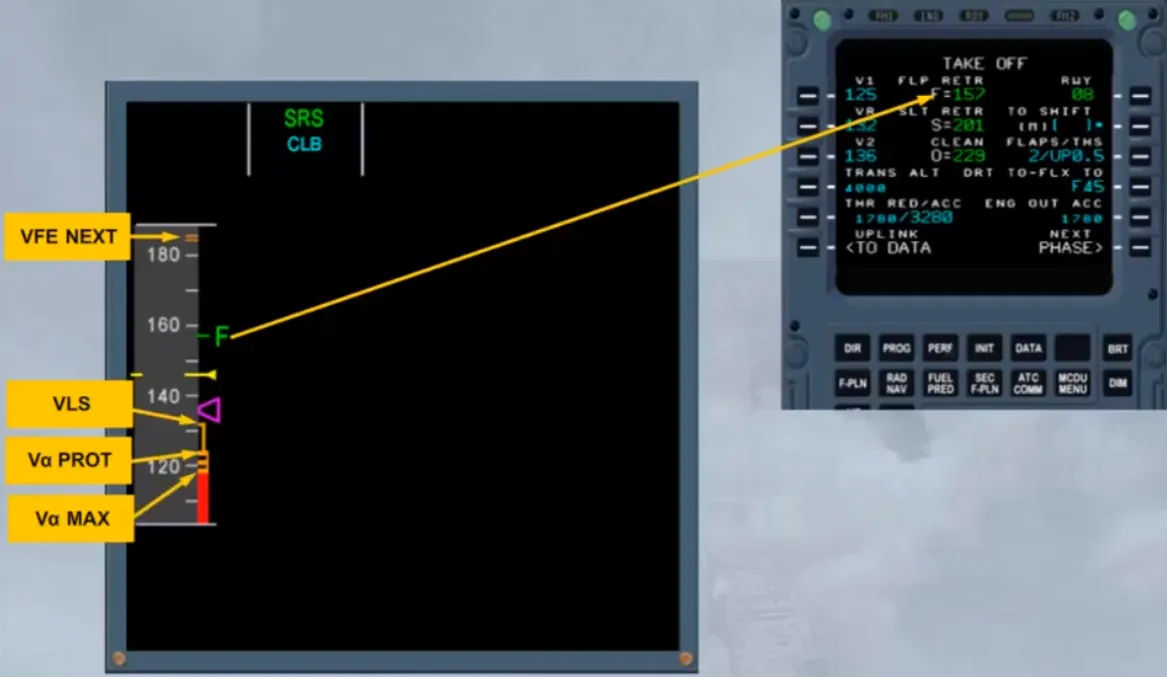
Also few seconds after lift off, the VLS, Vα PROT and Vα MAX are displayed. For more information, refer to the FLIGHT CONTROLS NORMAL LAW and PROTECTIONS module.
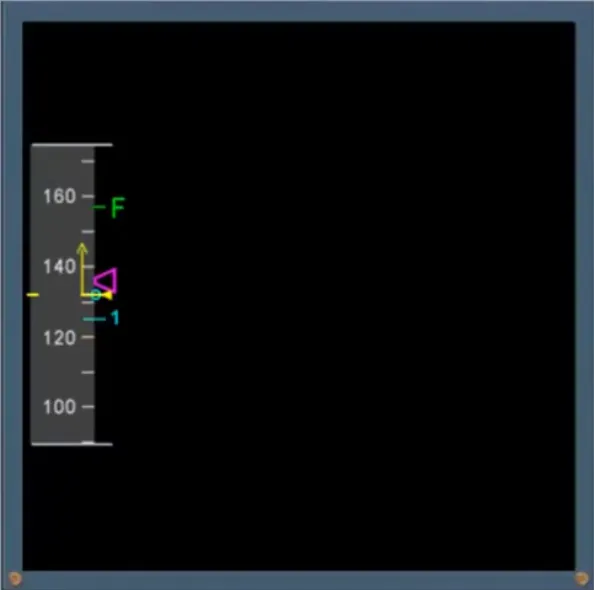
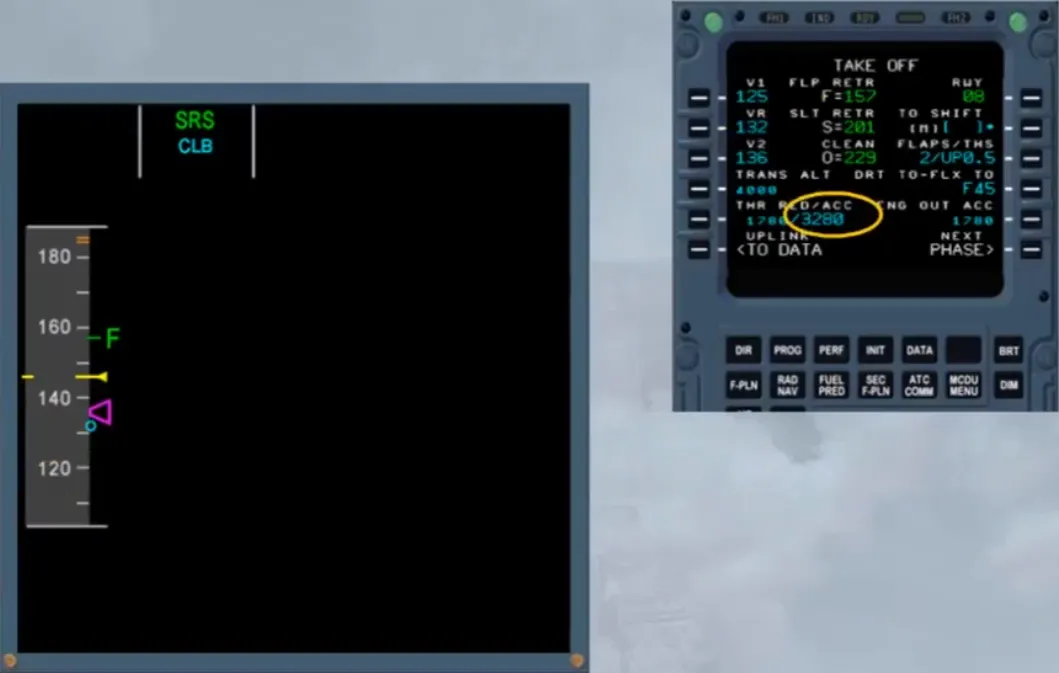
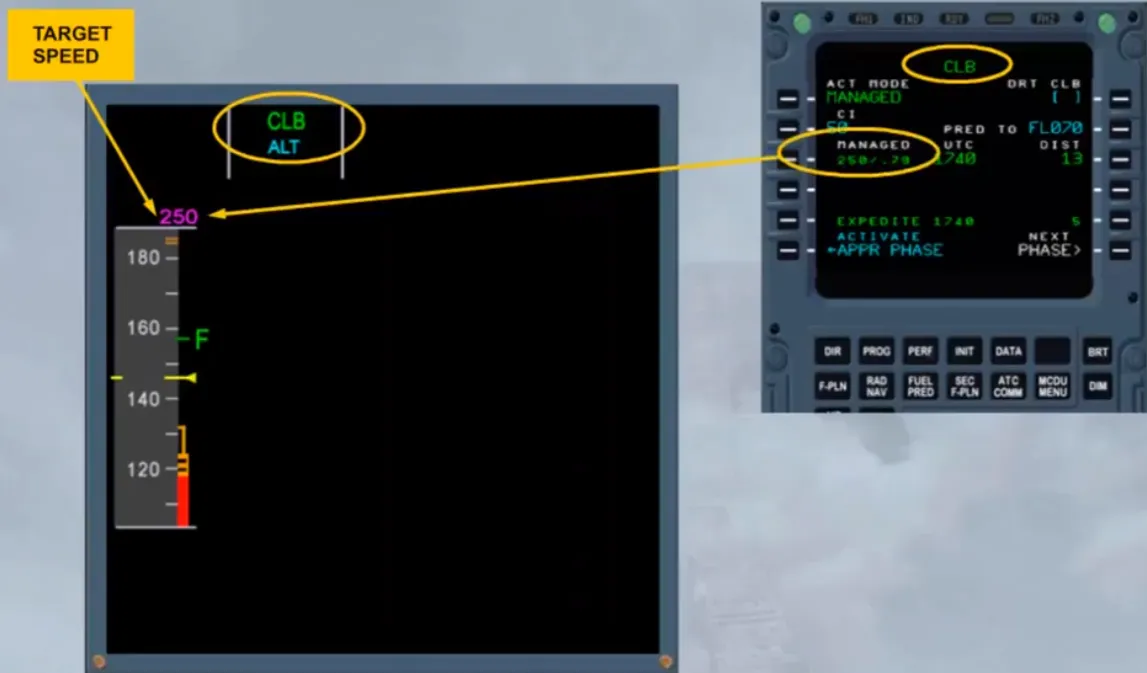
At acceleration altitude, the climb phase automatically activates, shown by the change on the MCDU and on the FMA. Also the target speed jumps to the climb speed. Notice that, since that speed is beyond the scale, it appears above the scale in magenta when managed by the FMGS or in blue if selected on the FCU.
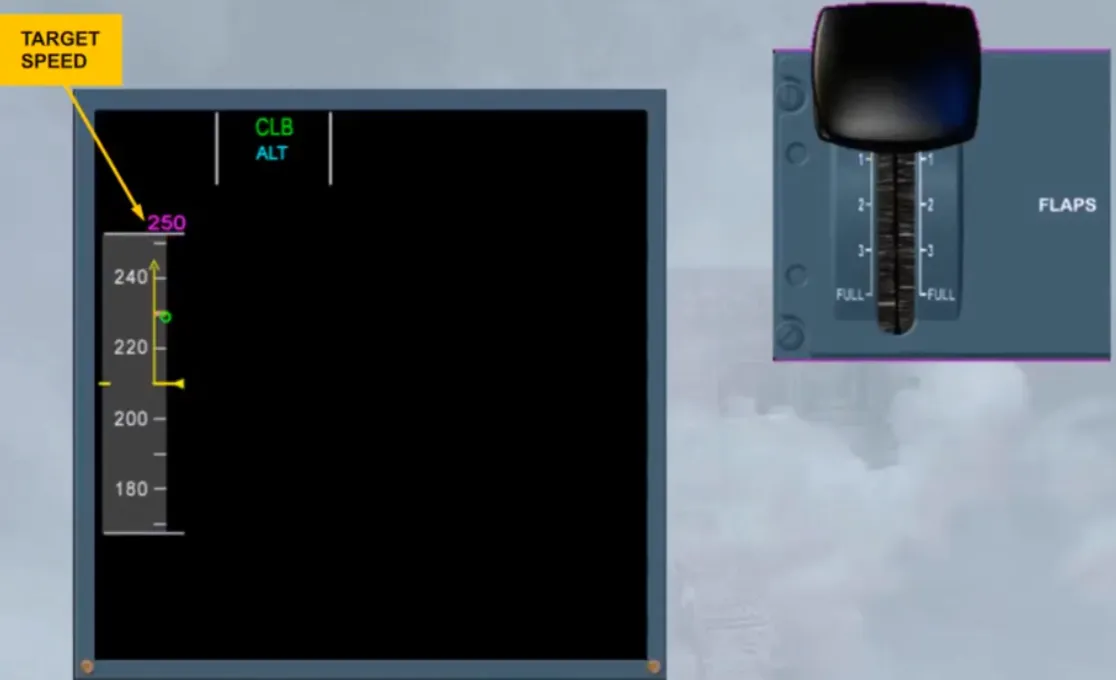
Then, the aircraft accelerates towards the target speed, as shown by the speed trend arrow. When the current speed is at F speed FLAPS 1 selection must be ordered.
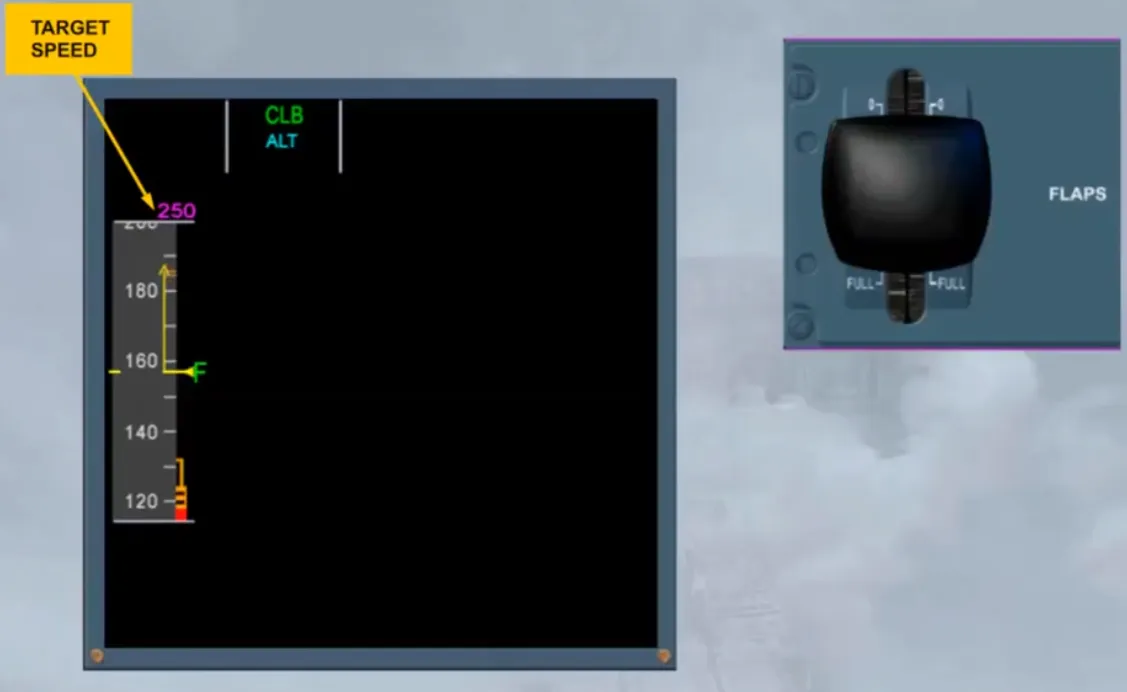
After FLAPS 1 selection, the “S” symbol appears with the new VFE NEXT, when they are visible.
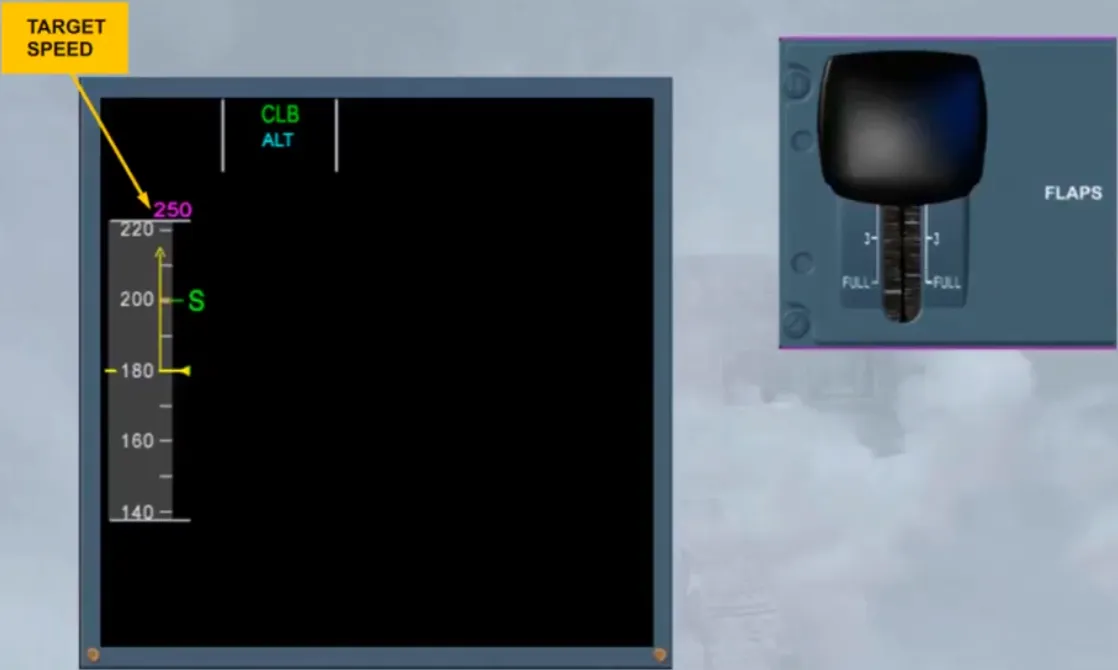
Note: The VMAX also appears on the speed scale when it is visible. VMAX is now VFE for the FLAPS 1 configuration.
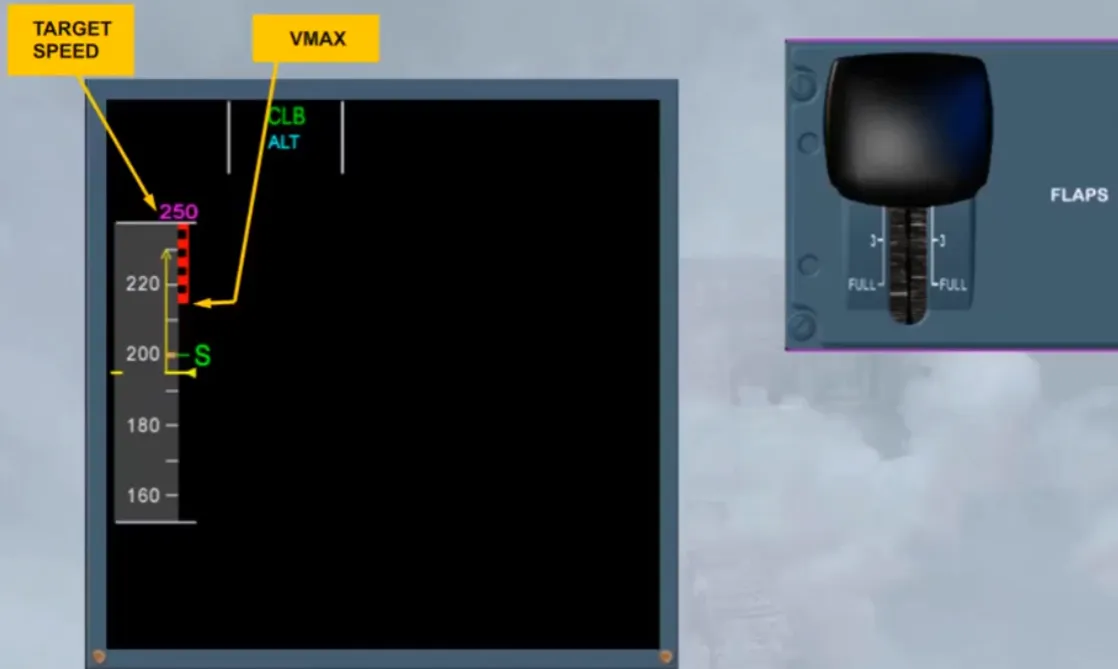
At “S” speed, FLAPS 0 must be ordered and selected.
When in clean configuration, the green dot speed is on the scale and corresponds to the best lift-to-drag ratio.
Note: The target speed triangle will be on the scale when it is visible. Also, VMAX is now VMO/MMO.
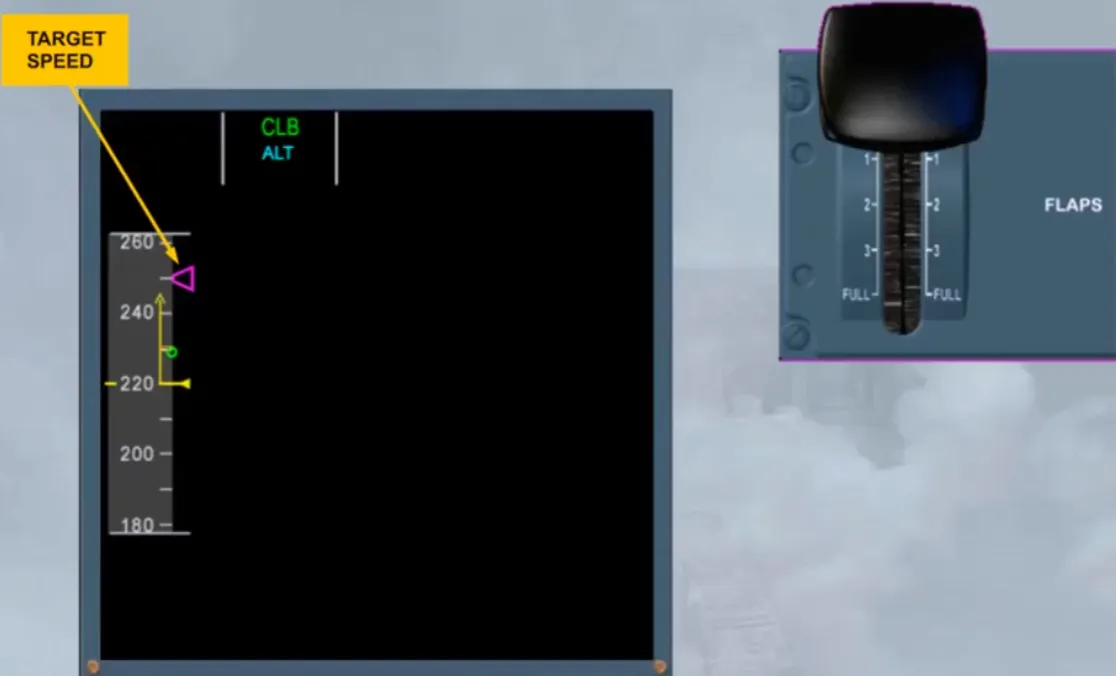
Notice that, when the speed stabilizes at 250 knots, the target speed is in line with the speed reference line.
Remember that, a target speed is:
- In magenta, when managed by the FMGS
- In blue, when selected by the pilot on the FCU.
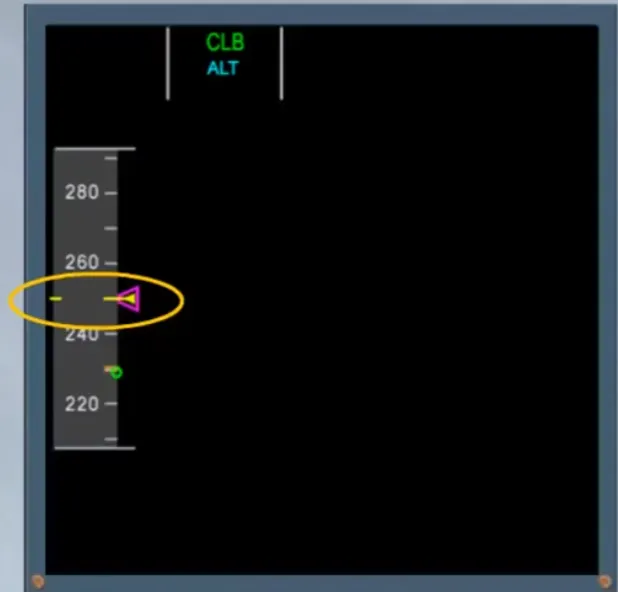
Then, when a new target speed is managed by the FMGS or selected on the FCU, the aircraft accelerates again towards this new target.
Also, when the current speed in mach is above 0.5, its number appears at the bottom of the speed scale.
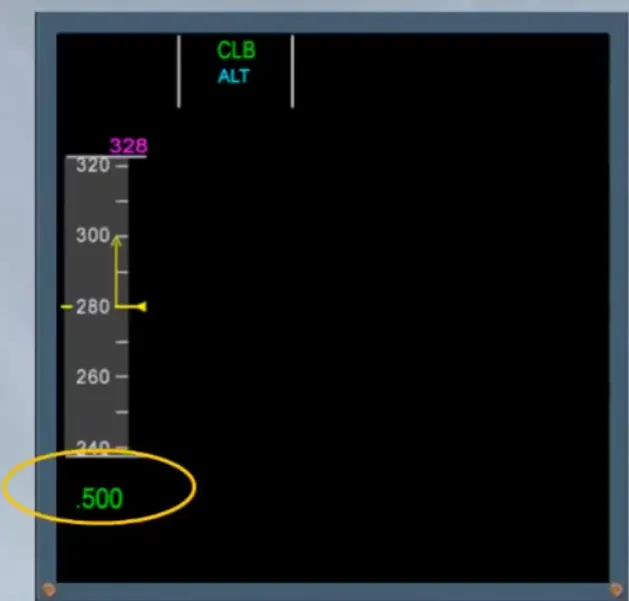
Note: VMAX appears when it is visible on the scale and is VMO/MMO. Also green dashes indicate the overspeed protection limit.
For more information, refer to the FLIGHT CONTROLS NORMAL LAW and PROTECTIONS module.
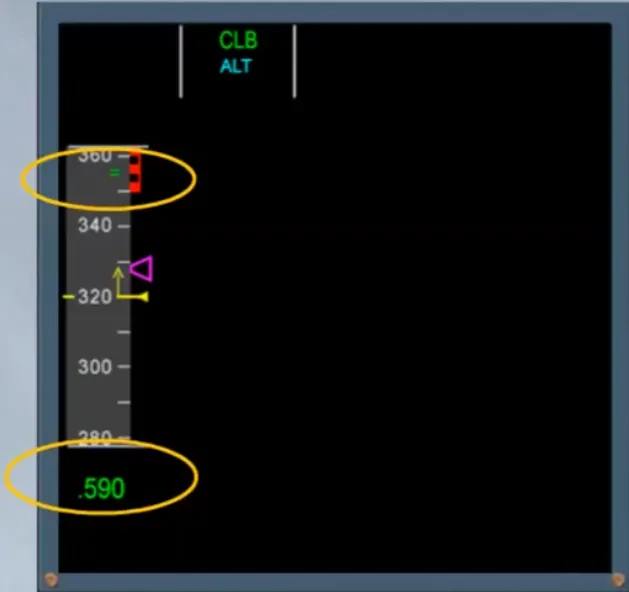
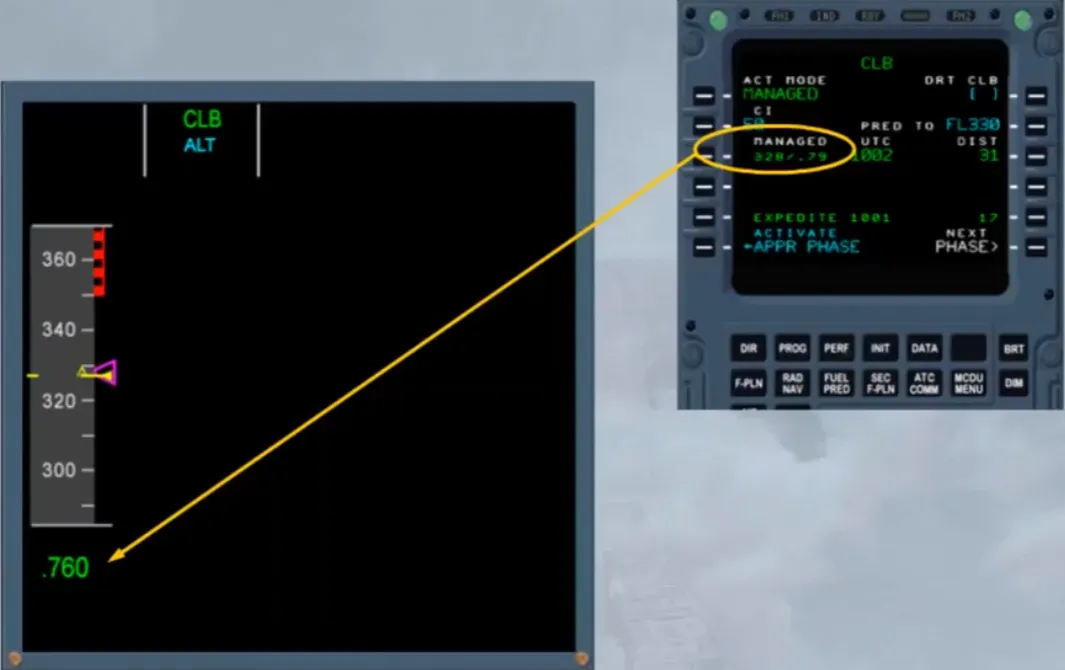
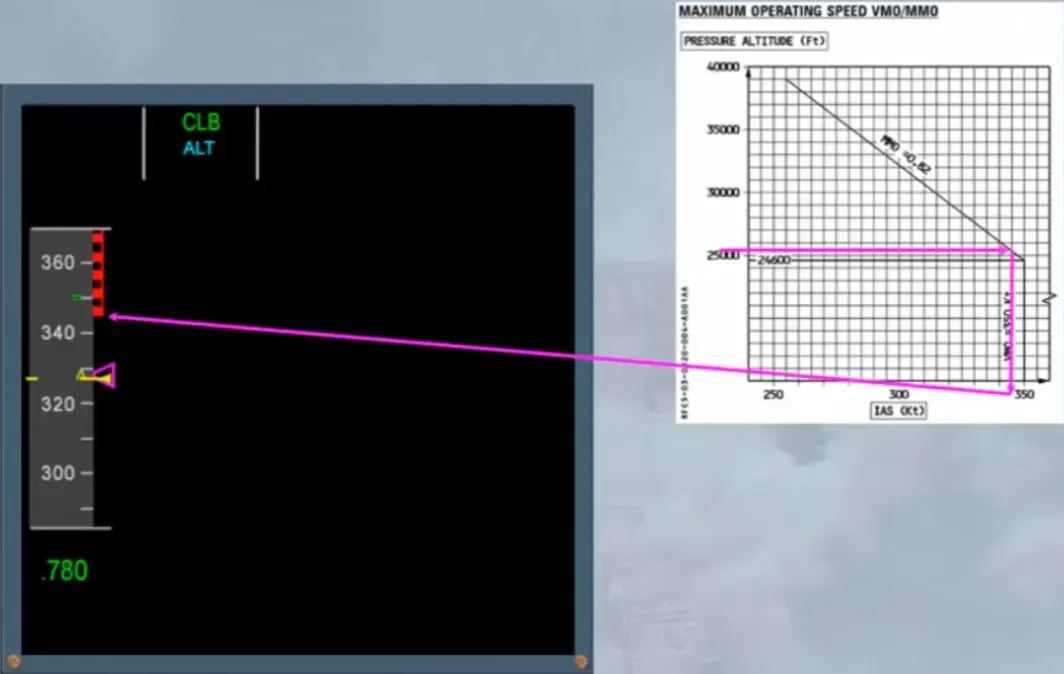
While climbing, the speed stabilized but the mach continues to increase towards the mach target managed by the FMGS.
Also, when above 25,000 ft, the VMO limit (350 kt) will change to MMO limit (0.82).
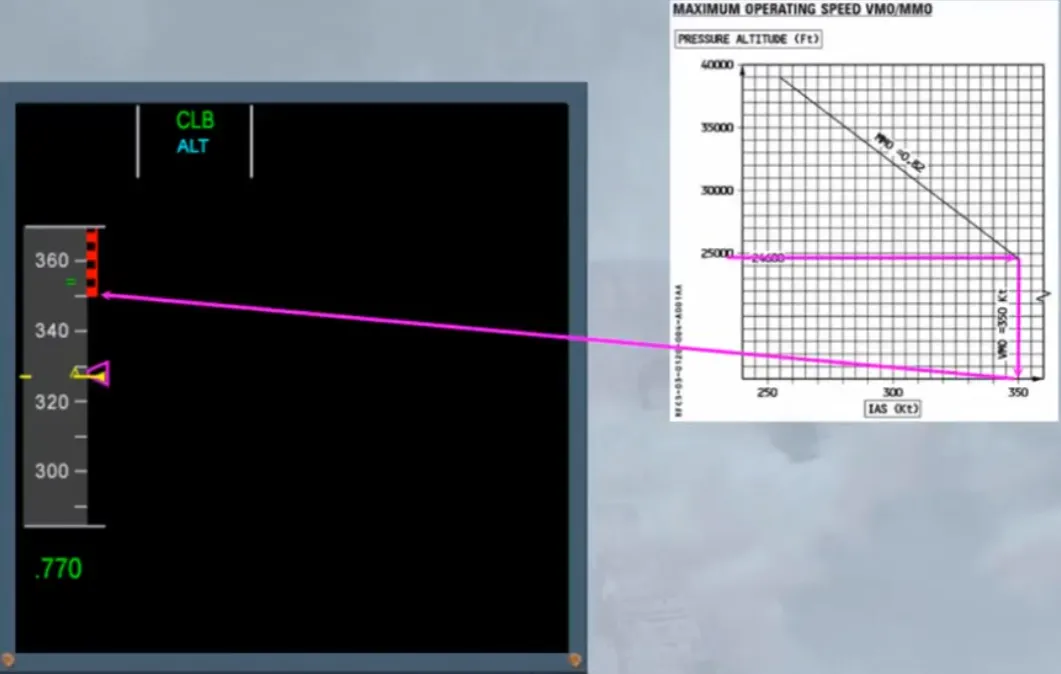
Note: The bottom of the red/black band will move down, because the maximum Mach is constant while the related speed is converted with the altitude, as shown on the chart of the FCOM LIM 13 section.
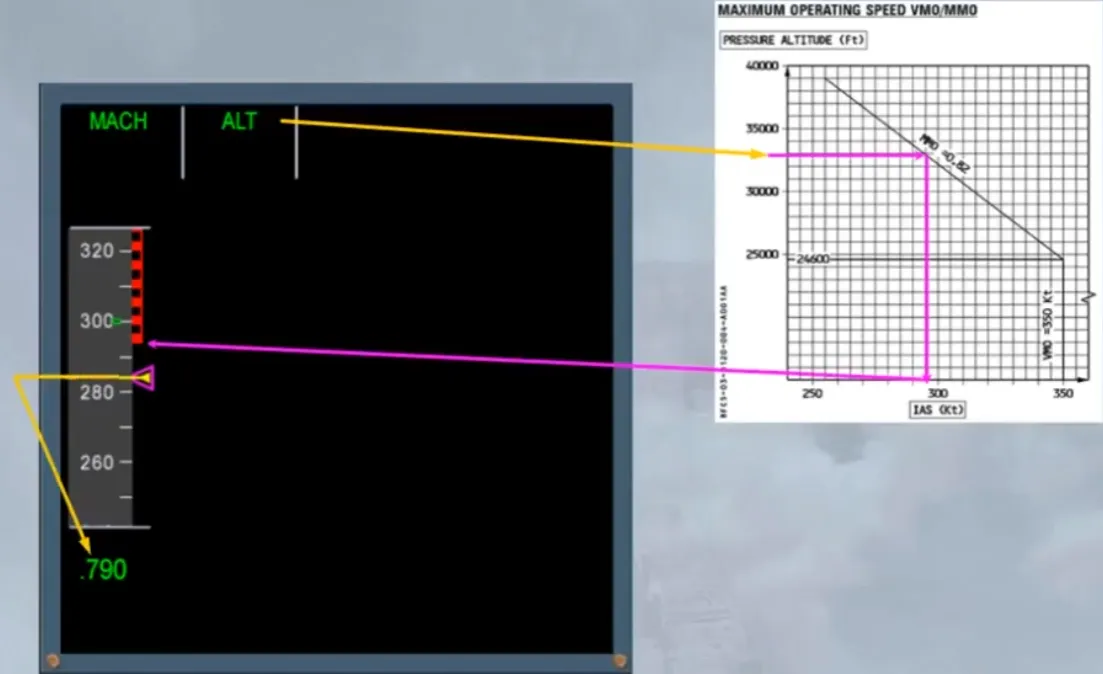
In the example shown, when the selected altitude of 33,000 ft is reached, the related VMAX and current speed target, relating to the mach target, are as shown.
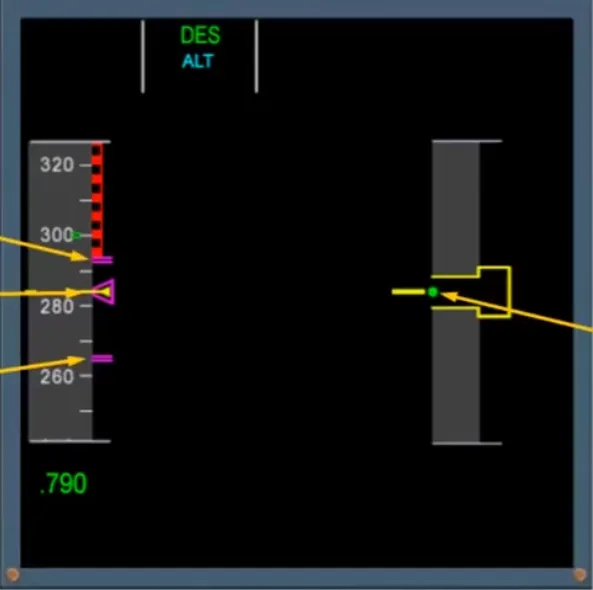
When a managed descent is initiated, a computed target with an upper limit target and alower limit target are on the speed scale.
Note: On the altitude scale, a green dot will indicate the deviation between the computed descent profile and the current one.
If the descent is initiated before reaching the computed T/D, the speed will decelerate to the lower limit target until reaching the descent profile.
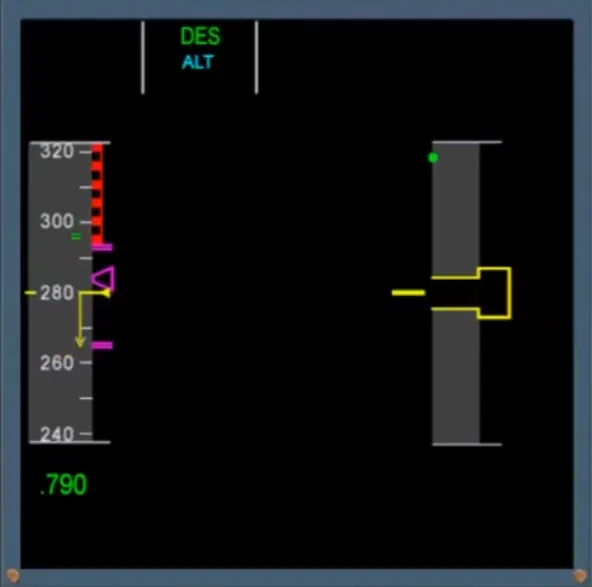
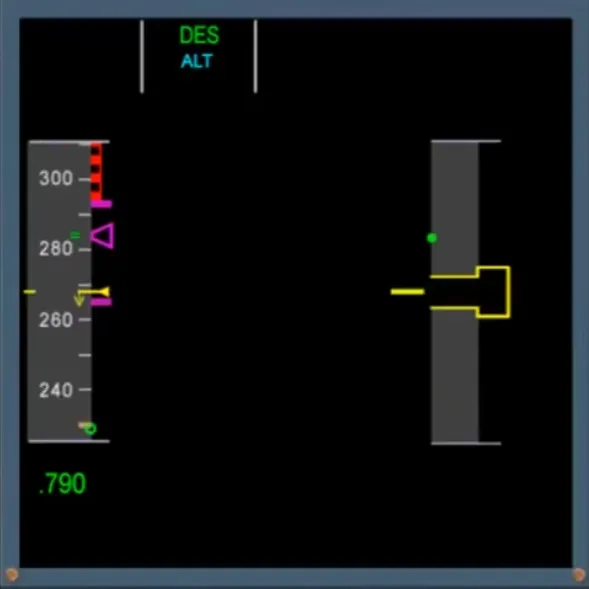
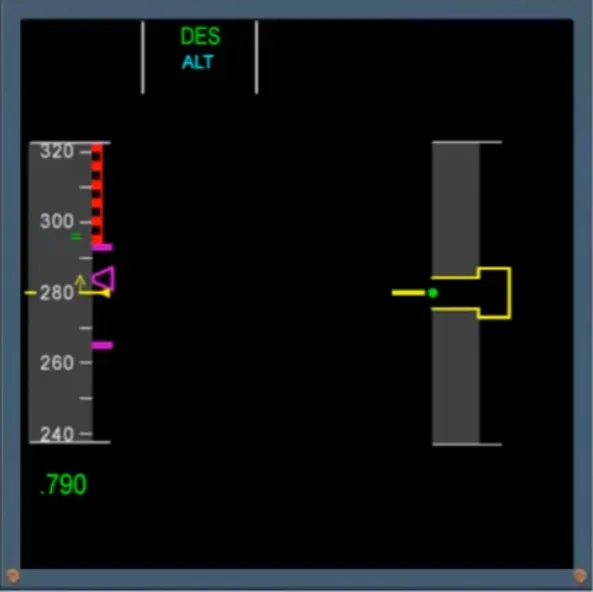
If it is initiated after the computed T/D, the speed will accelerate to the upper limit target until the descent profile.
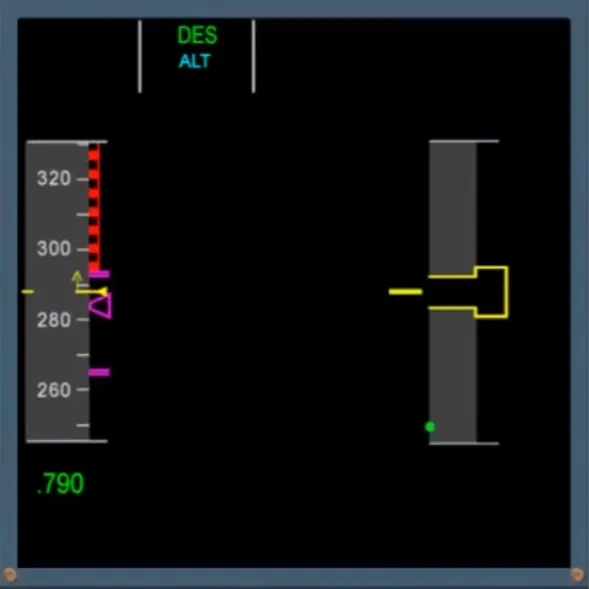
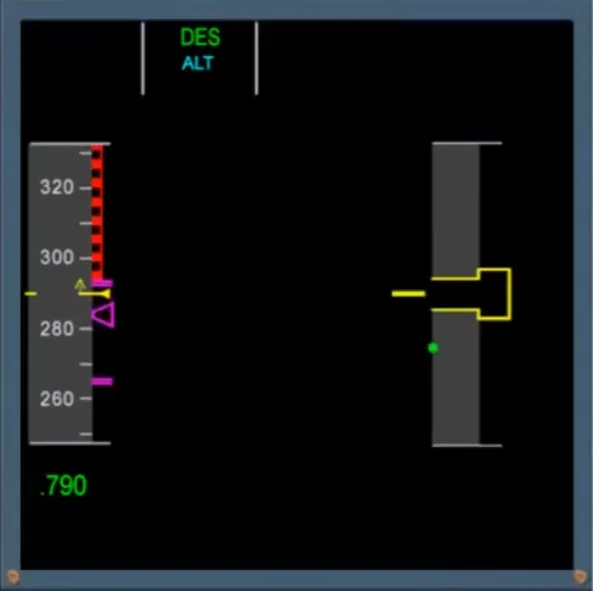
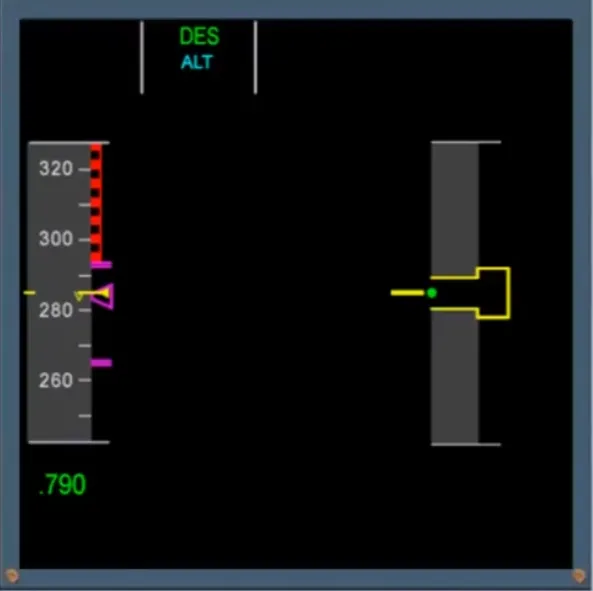
If it is initiated at the computed T/D, the speed will be on the target.
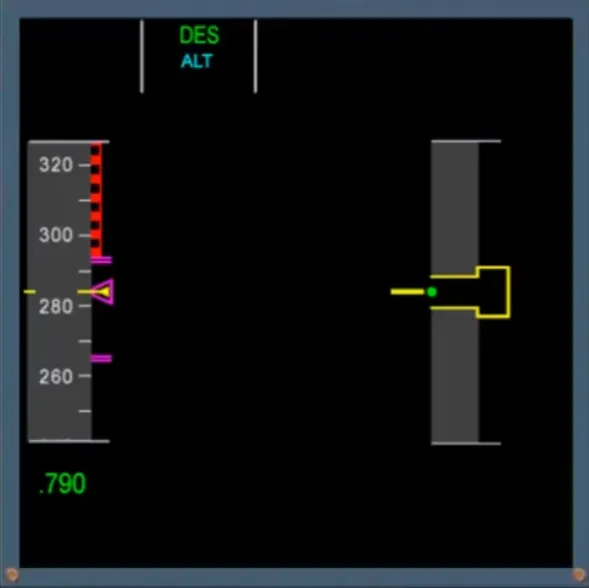
Following initial deceleration to 250 knots, and providing the altitude is below a threshold which depends on the FAC version, there is an indication of the next flap limiting speed. When it is visible, this corresponds to the VMAX for FLAPS 1 selection.
Green dot speed may be also visible.
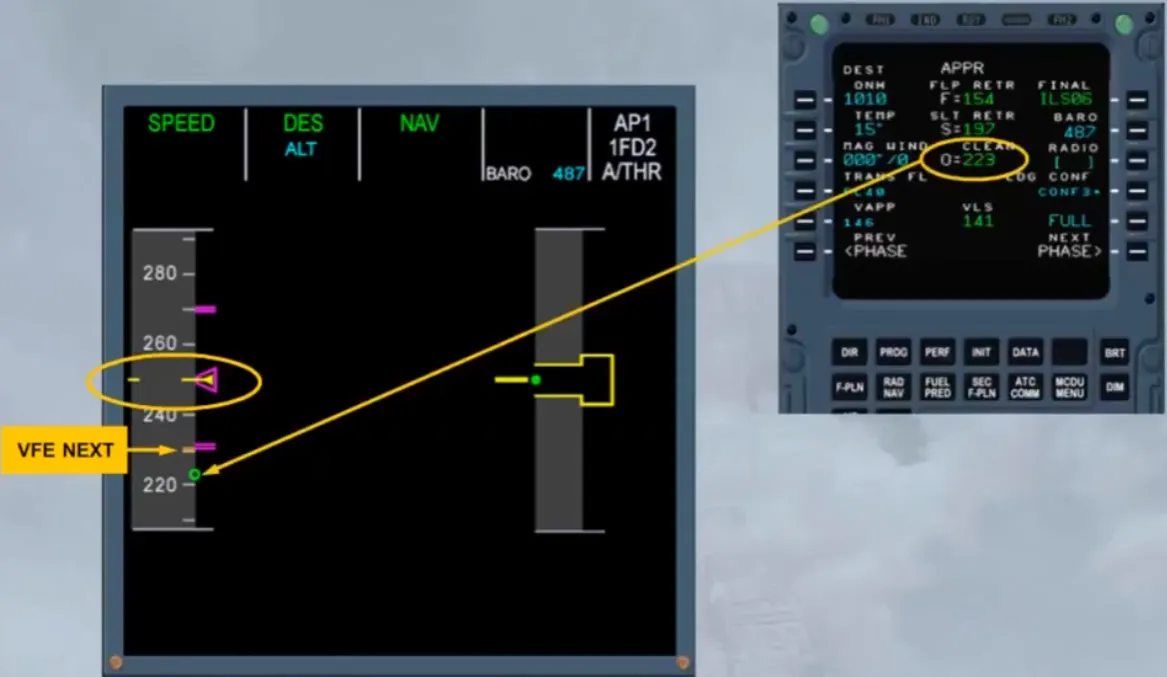
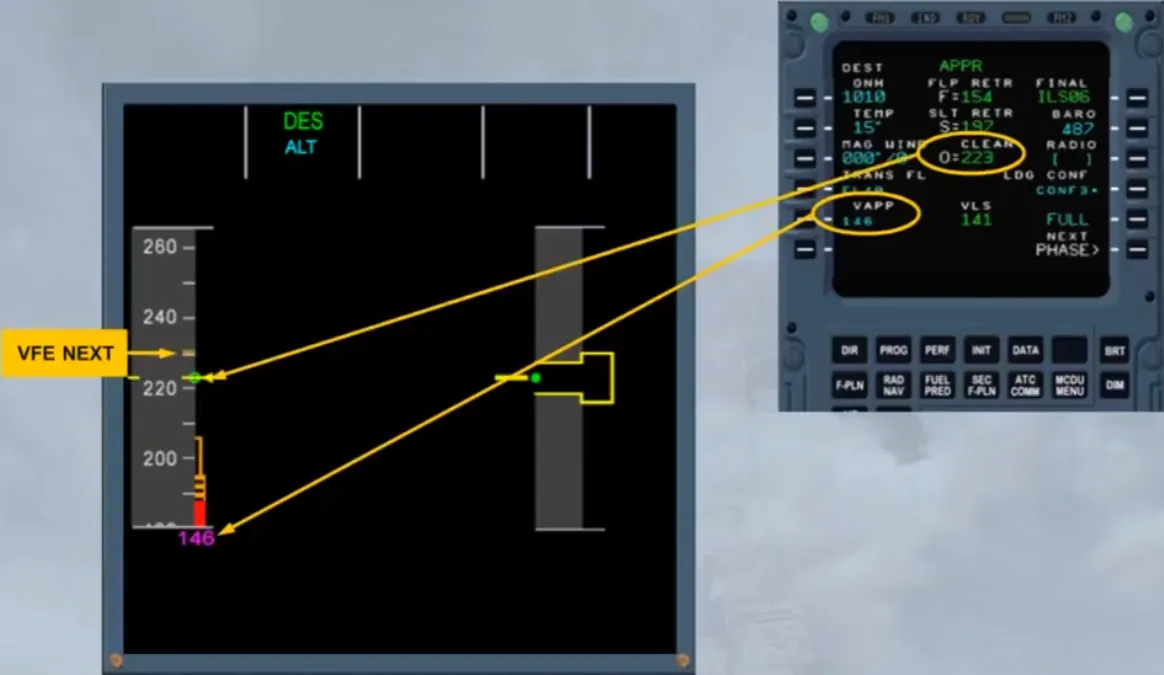
When an FM approach phase is activated, the target speed jumps to the VAPP and commands a further deceleration to green dot speed.
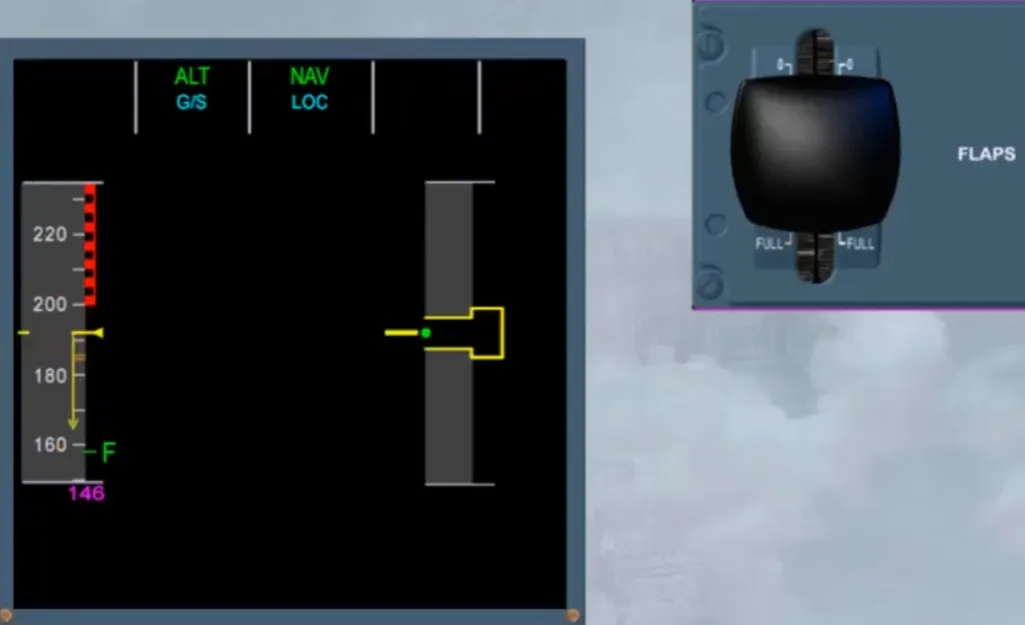
When the current speed is below the VFE NEXT, or has stabilized at green dot speed, FLAPS 1 can be selected.
Once the flap lever is in position 1, S speed, VFE next and the flap limit speed indications will appear.
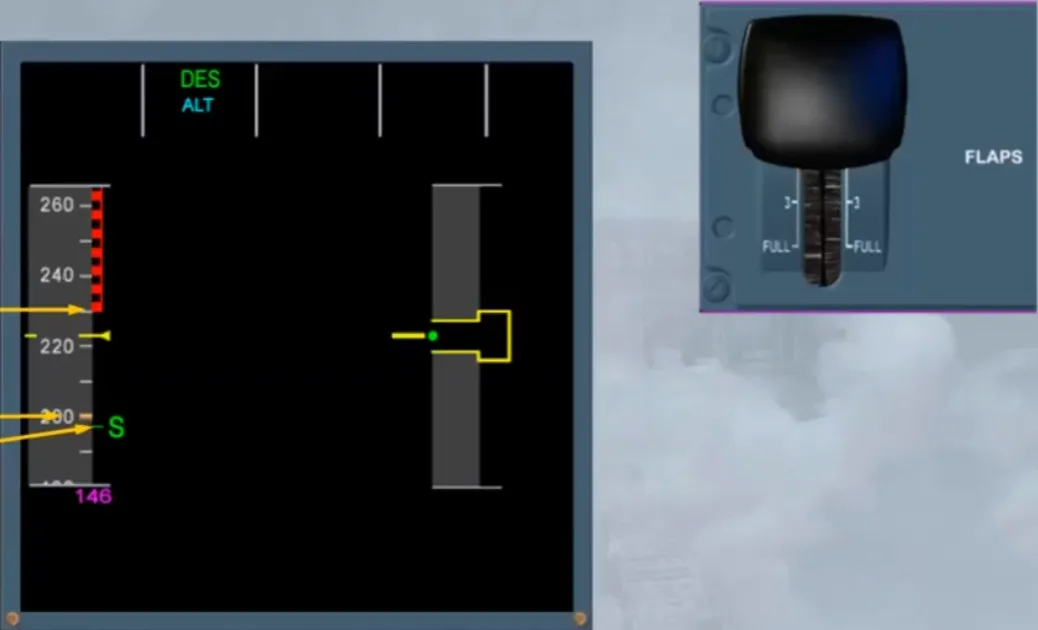
The speed will decrease towards S speed.
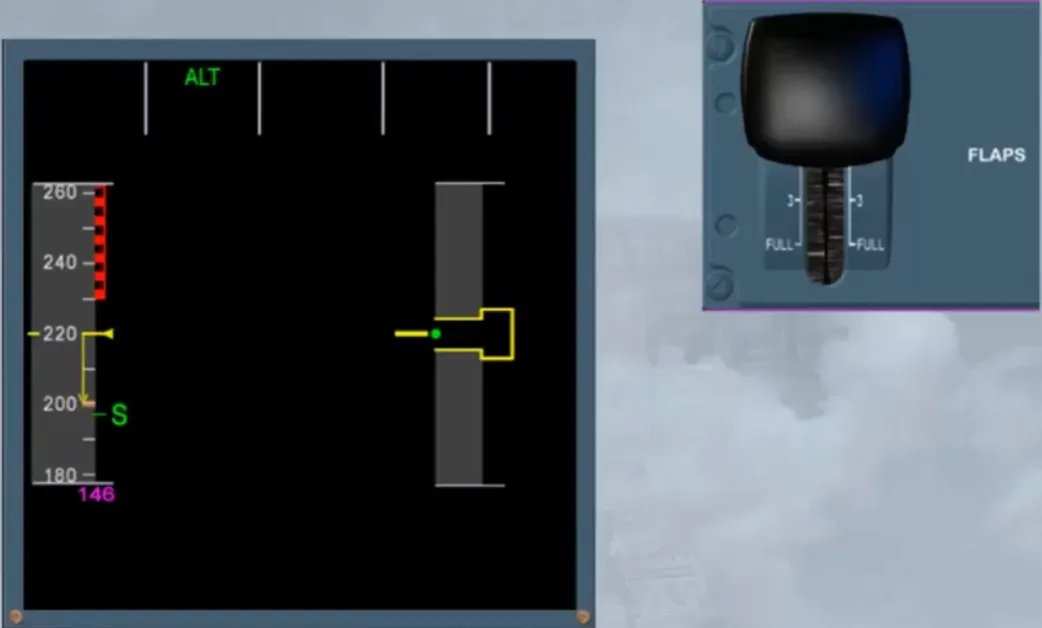
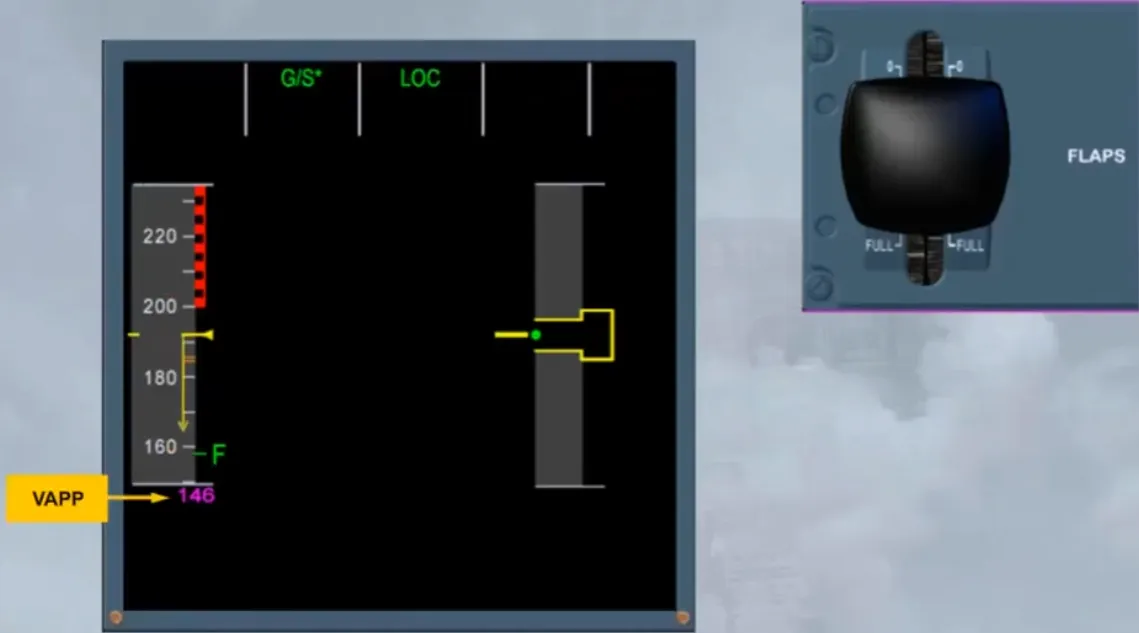
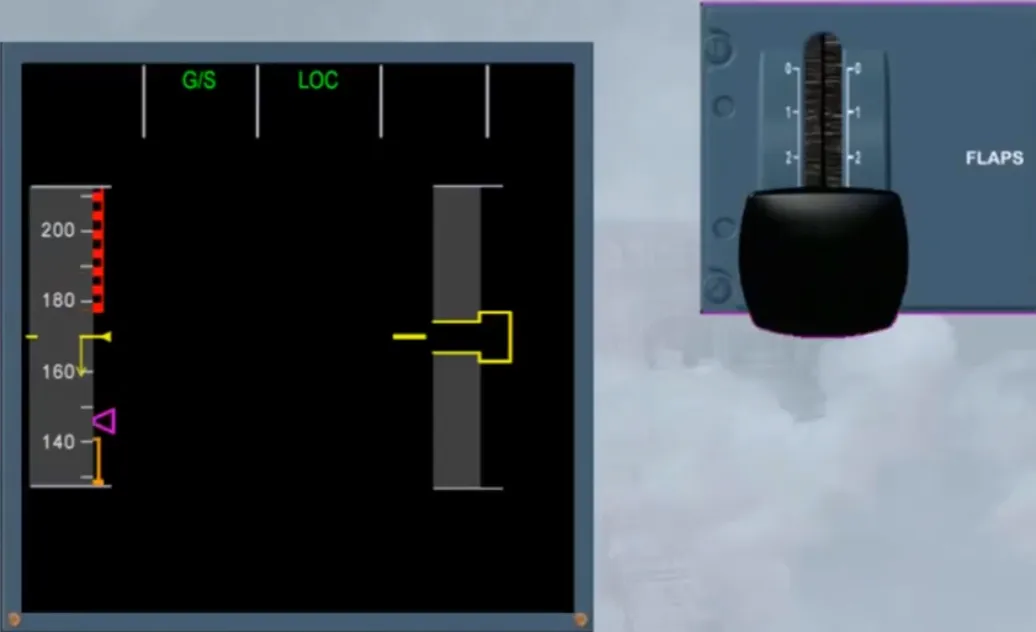
When the current speed is below the VFE NEXT, or has stabilized at “S” speed, FLAPS 2 can be selected.
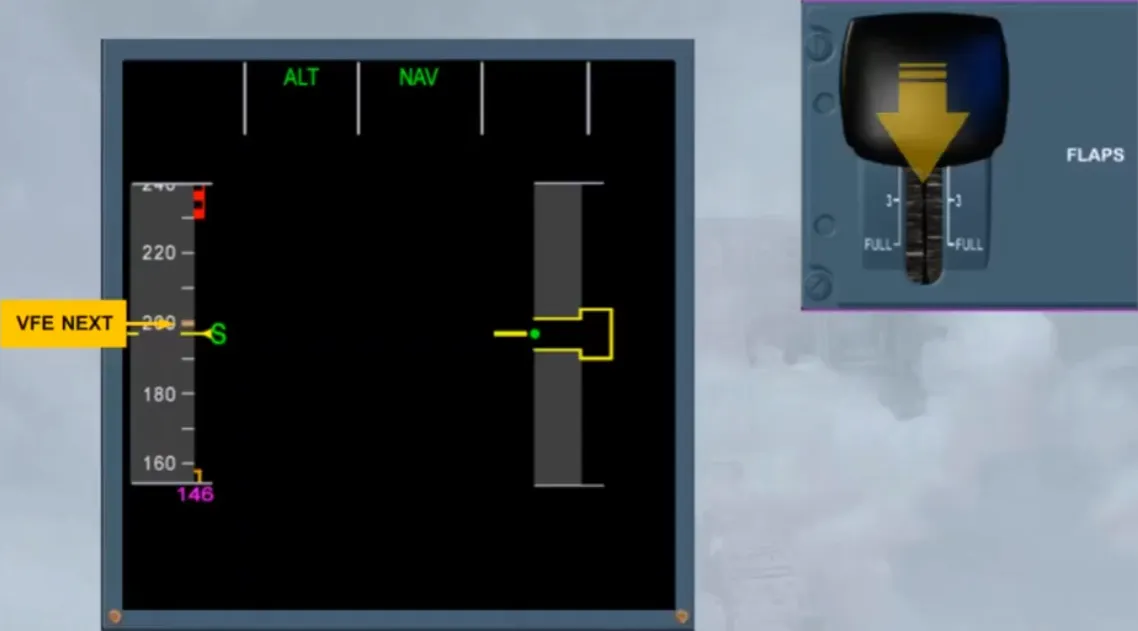
Once the flap lever is in position 2, “F” speed and a new VFE next will appear.
The flap limit speed indications will move. The speed will decrease towards “F” speed.
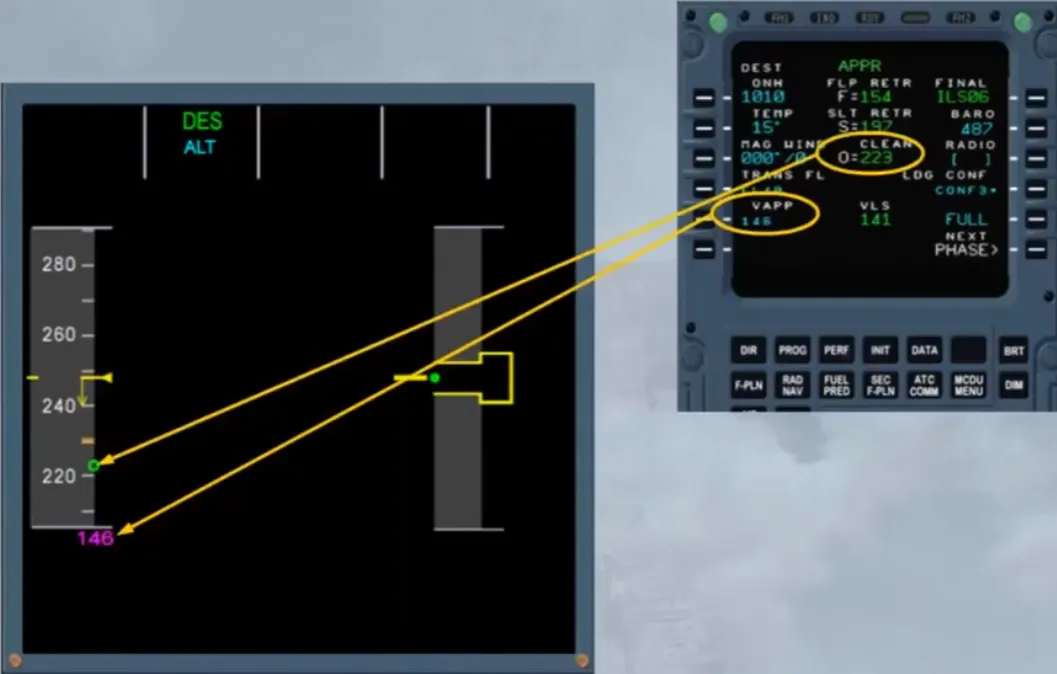
Notice that the VAPP target speed is now on the scale.
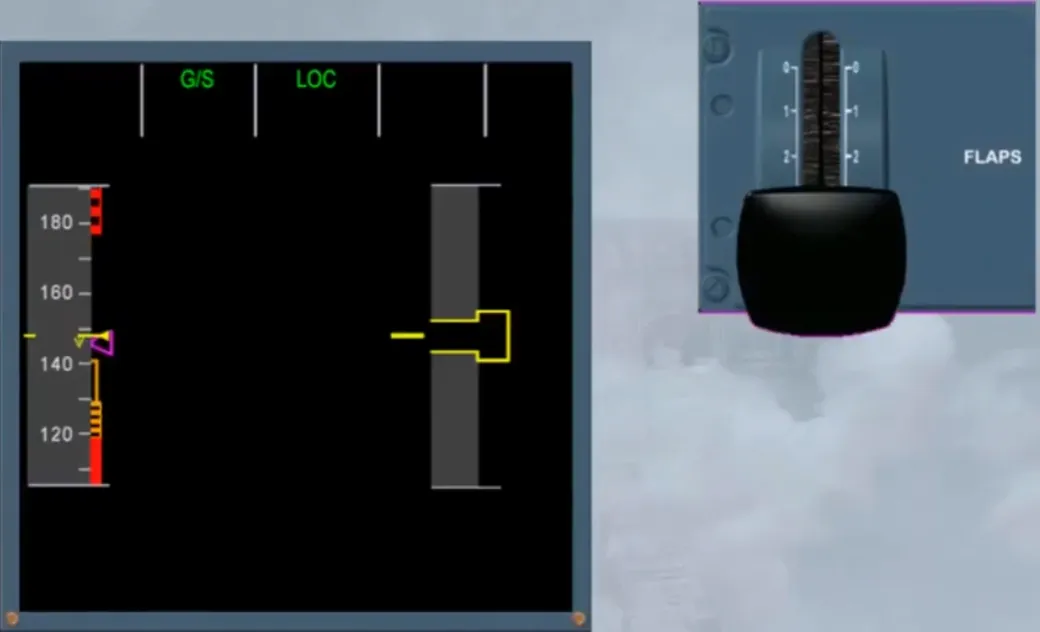
When the current speed is below the VFE NEXT or has stabilized at “F” speed, FLAPS 3 can be selected.
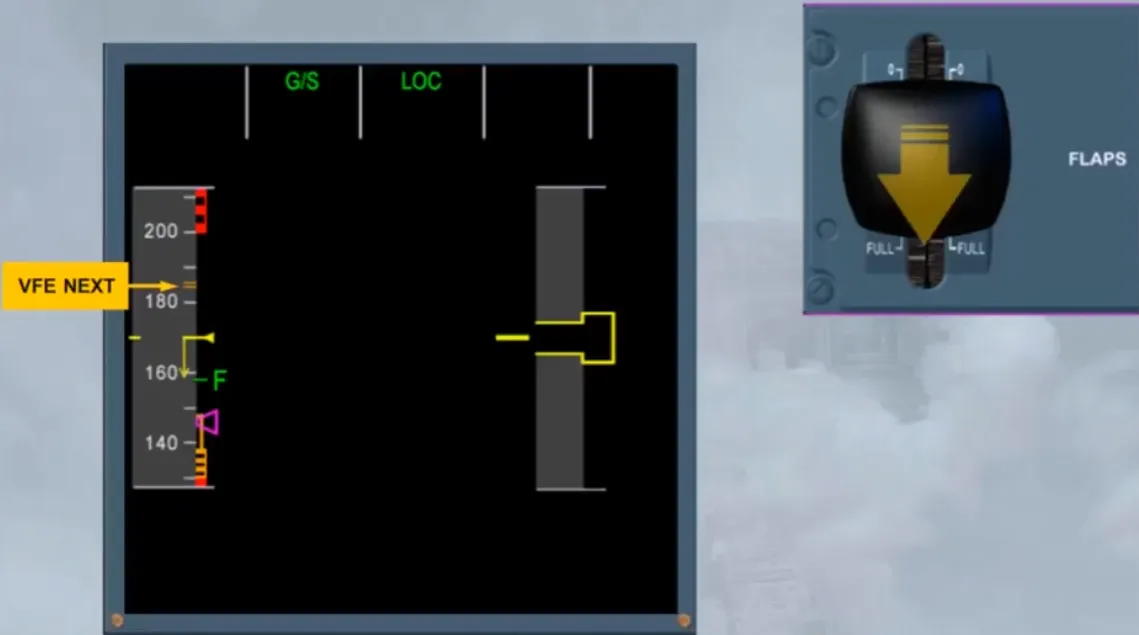
Once the flap lever is in position 3, a new VFE next will appear. The flap limit speed indications will move.
Then, FLAPS FULL can be selected.
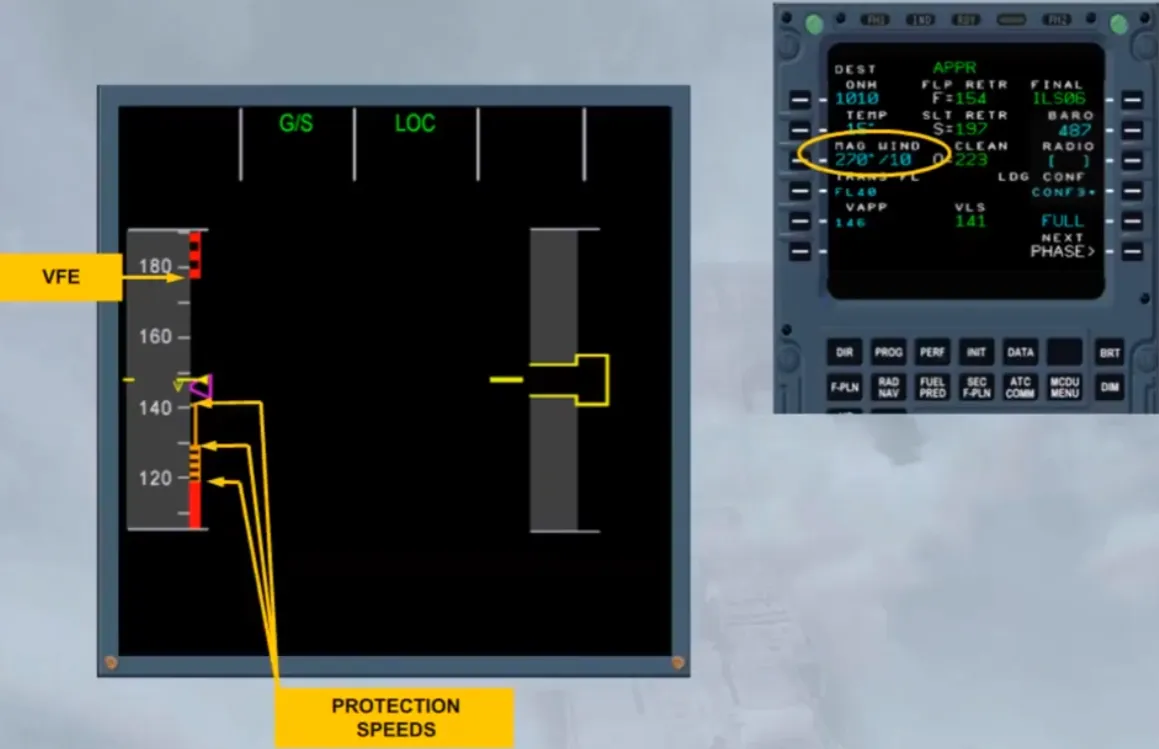
According to the wind conditions which may vary during approach, the target speed will be adjusted between the VAPP and the VFE of the related FLAPS configuration.
The wind, which has been entered on the PERF APPR page, will be used to compute a minimum energy level. This minimum energy level relates to the ground speed the aircraft will have at touchdown and is called “GROUND SPEED MINI”.
There are indications associated with speed and angle of attack protections. These protection indications will be discussed in the flight control modules.
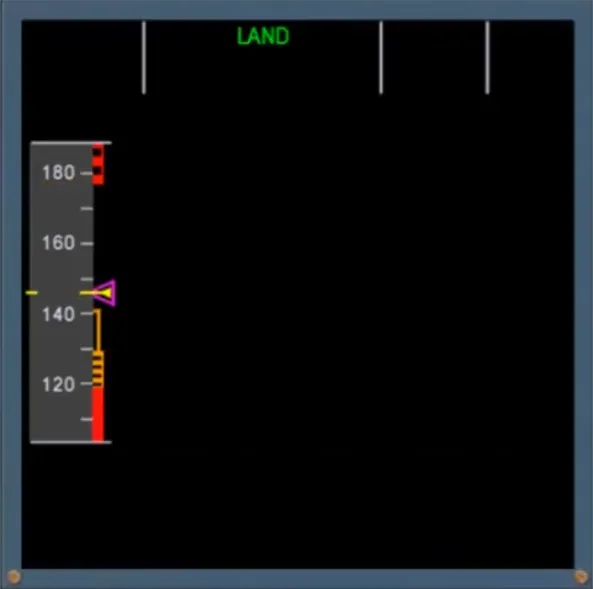
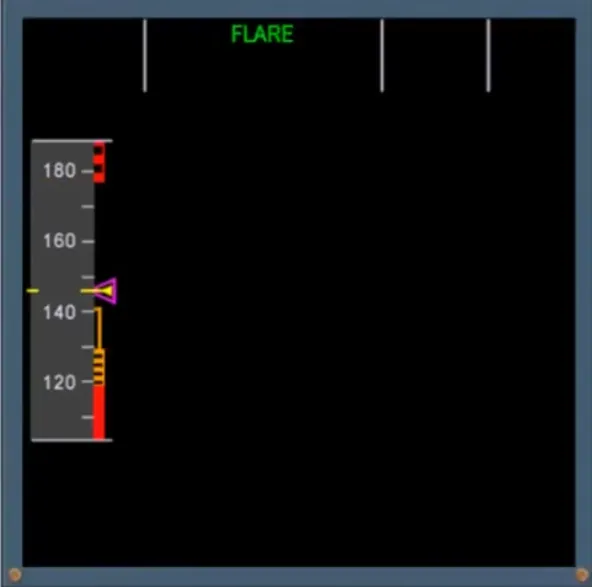
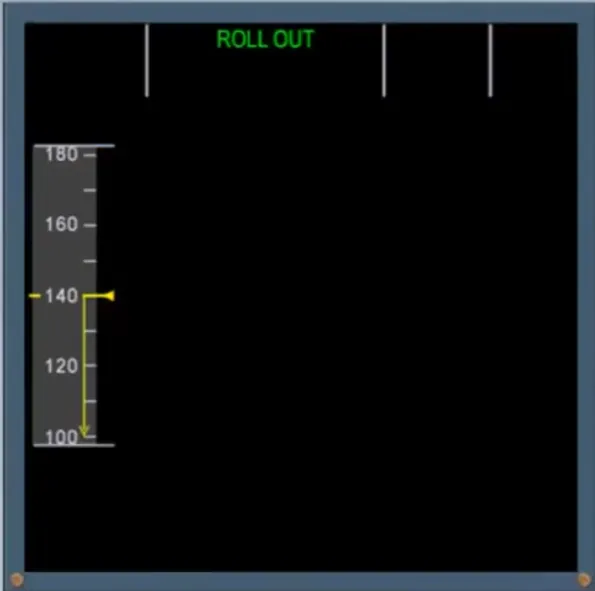
Once the aircraft lands, all additional speed indications are removed apart from the speed trend arrow.
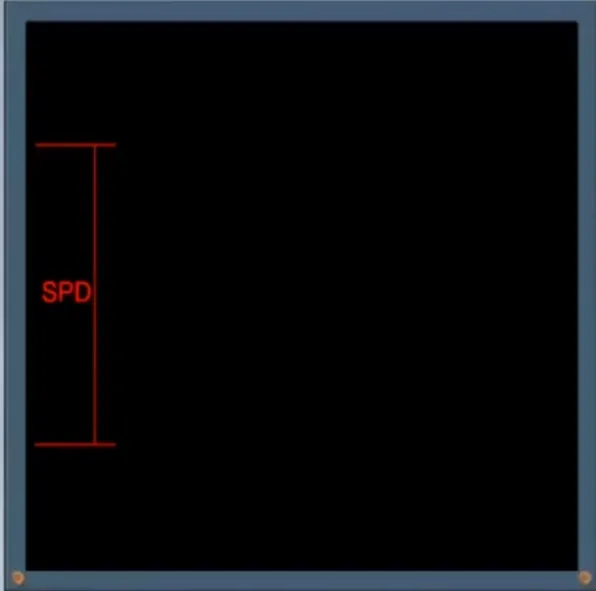
When the three ADR cannot provide the airspeed information and if they have been switched off, the airspeed flag is replaced by a backup speed indication based on an angle of attack and on the FLAPS configuration.
Note: When not in clean configuration, it changes as shown. For additional information refer to ATA 34 - NAVIGATION ADIRS PRESENTATION module.
Let’s now look at the altitude indications.
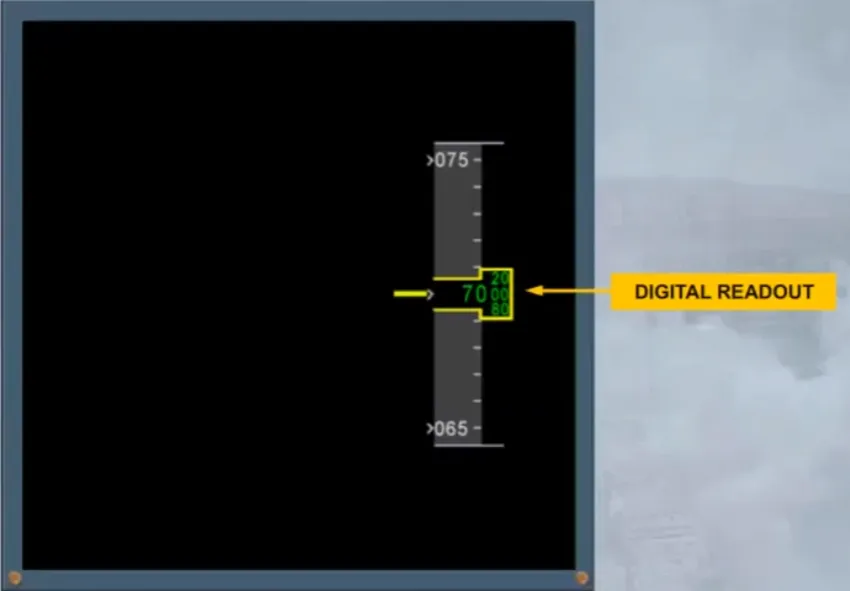
All the indications associated with altitude are located on the right hand side of the PFD.
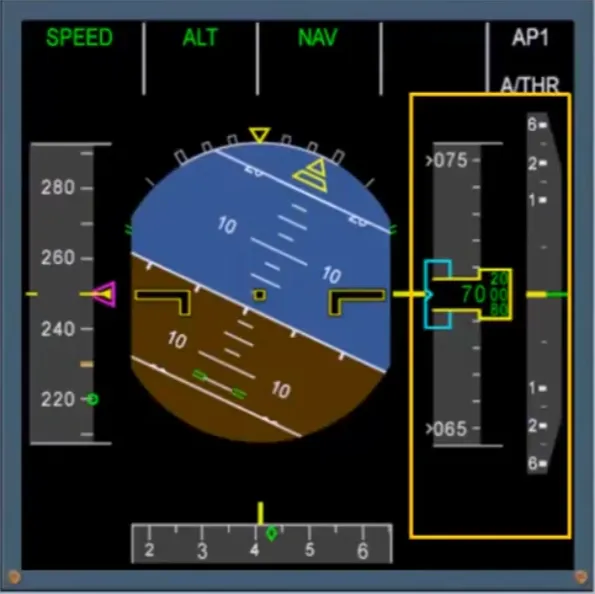
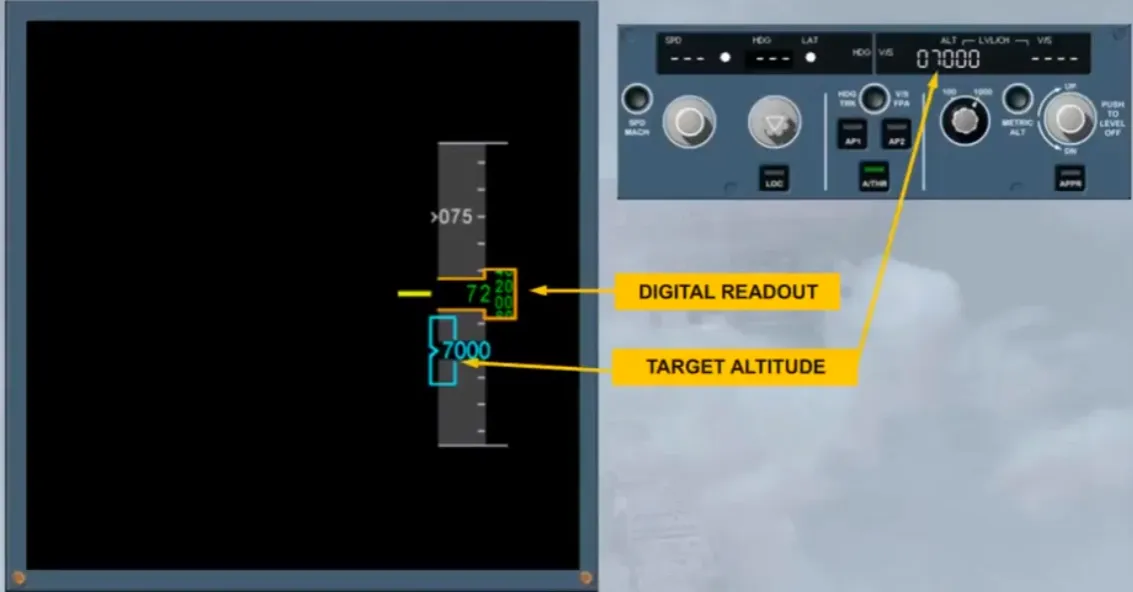
Like the airspeed indication, a grey analog altitude tape moves behind the digital display.
The altitude window will change from yellow to amber when the aircraft deviates from the FCU selected altitude, which is displayed in blue as shown.
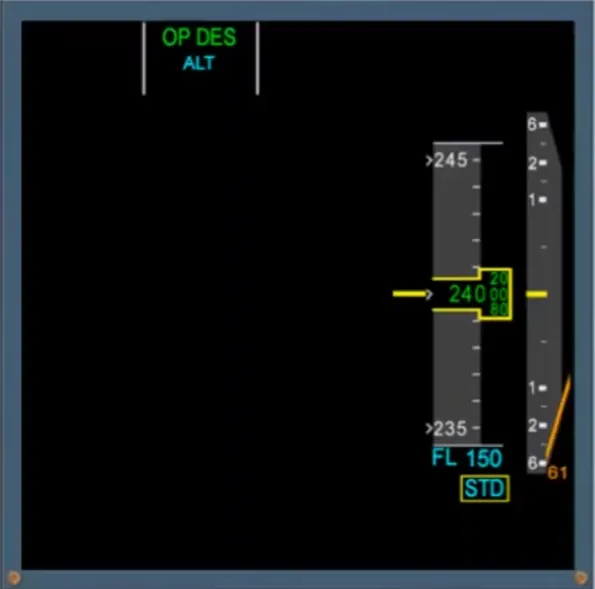
During a managed descent a green dot will indicate the deviation between the current descent profile and the computed one.
If there is an altitude constraint on the managed flight plan, the FMA ALT indication and the target altitude change from blue to magenta.
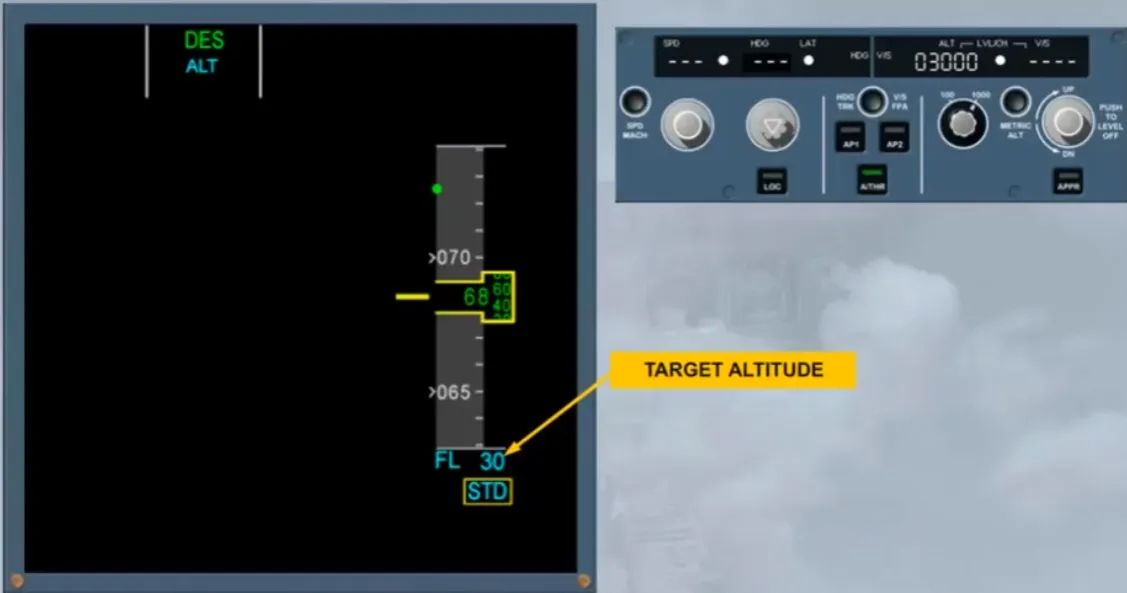
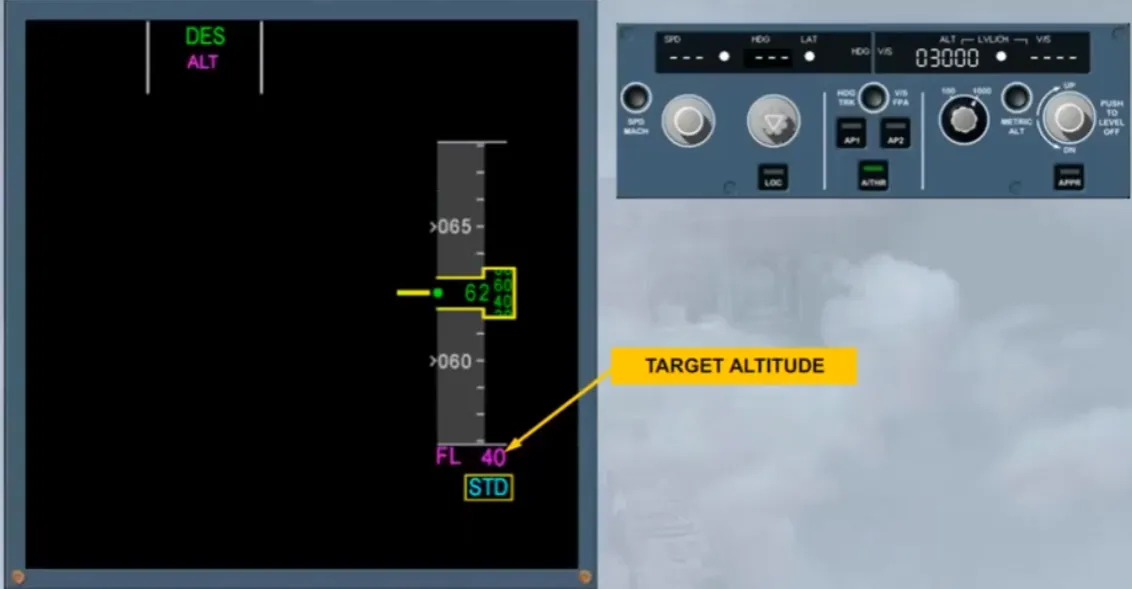
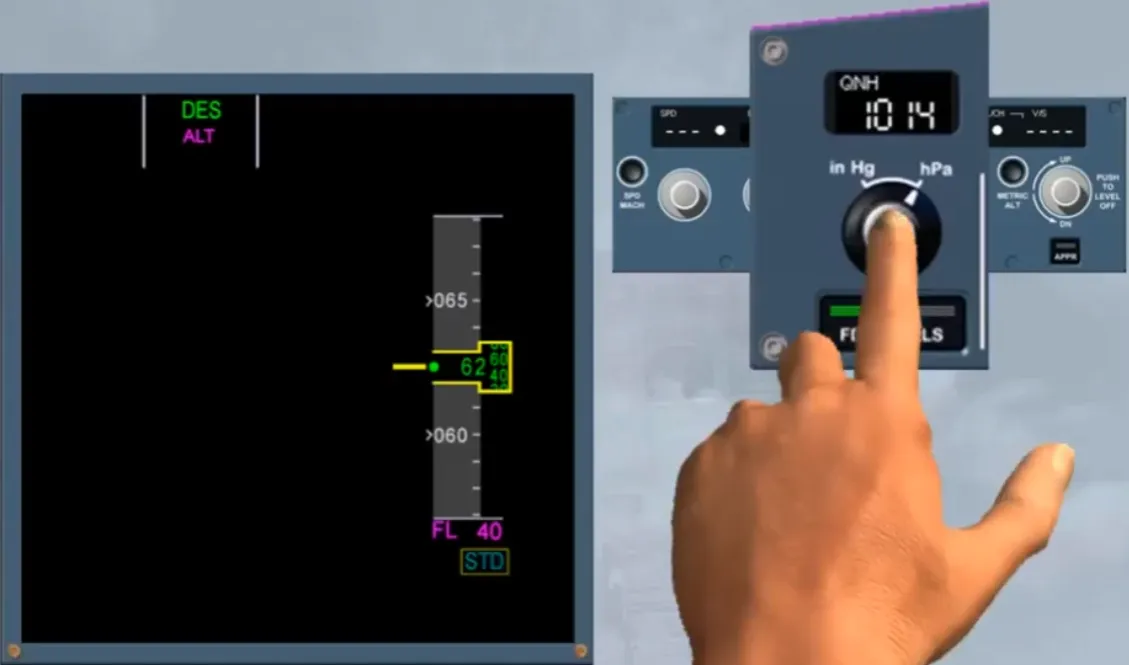
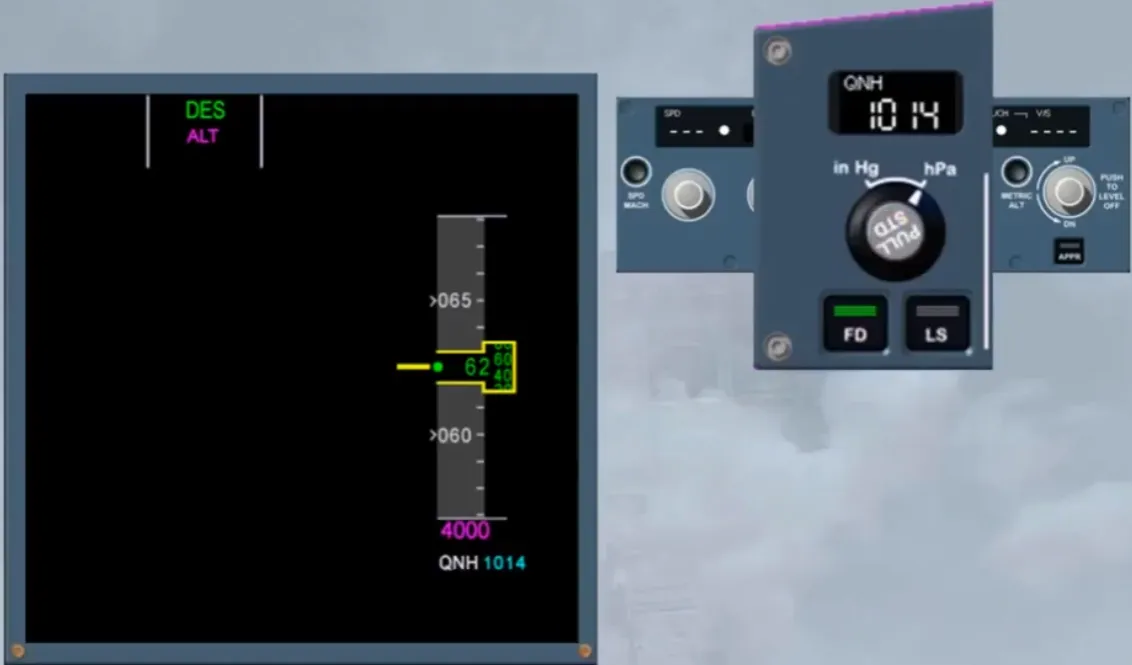
Notice that when the altitude is below the transition altitude, the STD indication pulses alerting the pilot to set the QNH or the QFE by pushing the BARO knob.
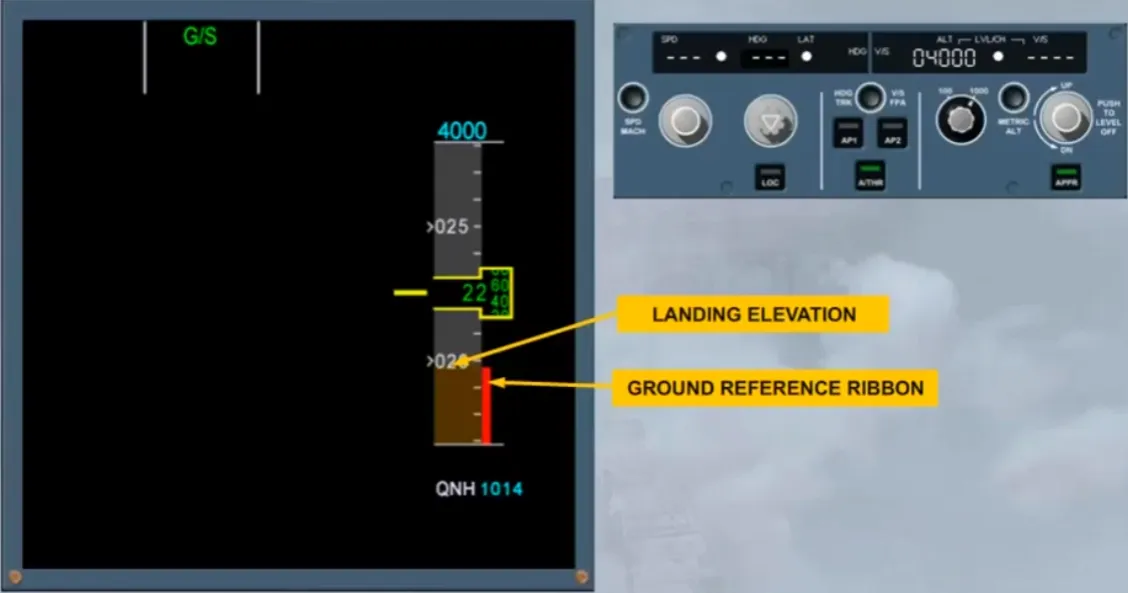
A red ribbon, to the right of the altitude scale, represents the ground reference, based on the radio altitude information.
Note: It appears when the RA is below 570 ft.
Also, the top of a brown ribbon, on the altitude scale, represents the landing elevation provided by the FMS data base.
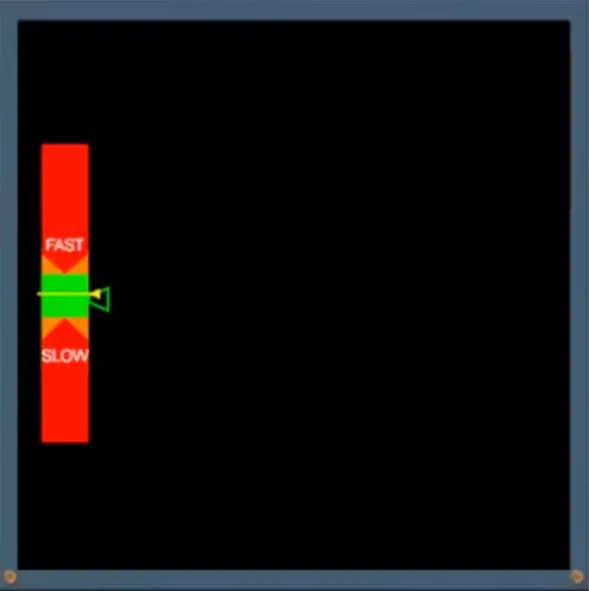
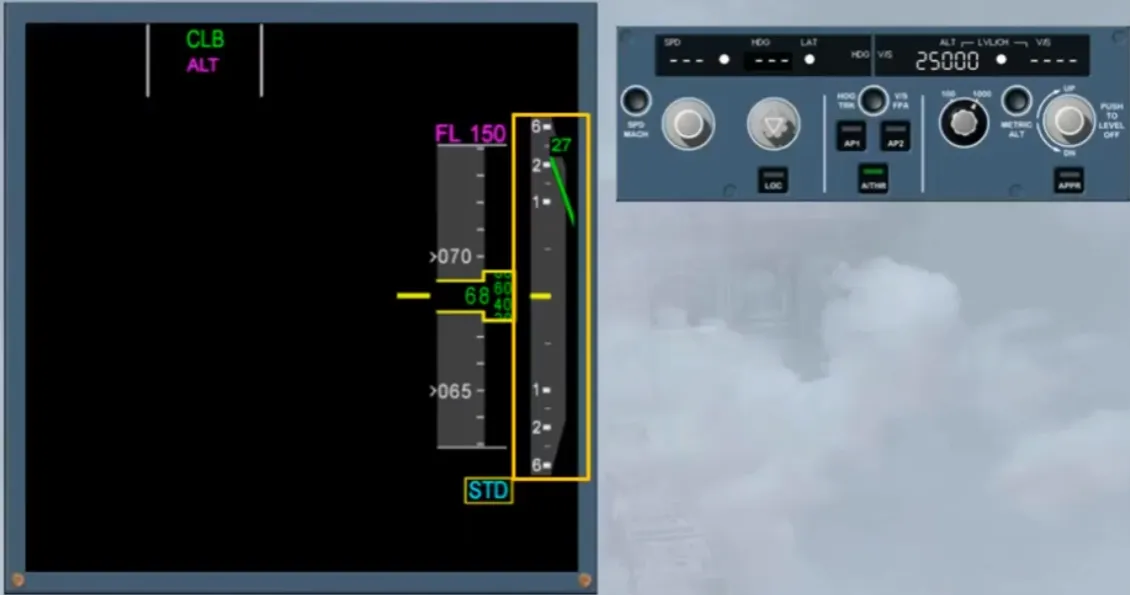
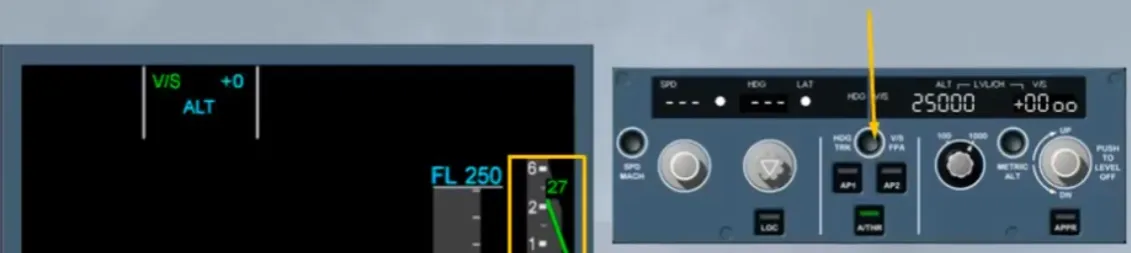
The vertical speed indication is displayed as shown. Note: The current V/S is 2700 feet/minute in climb.
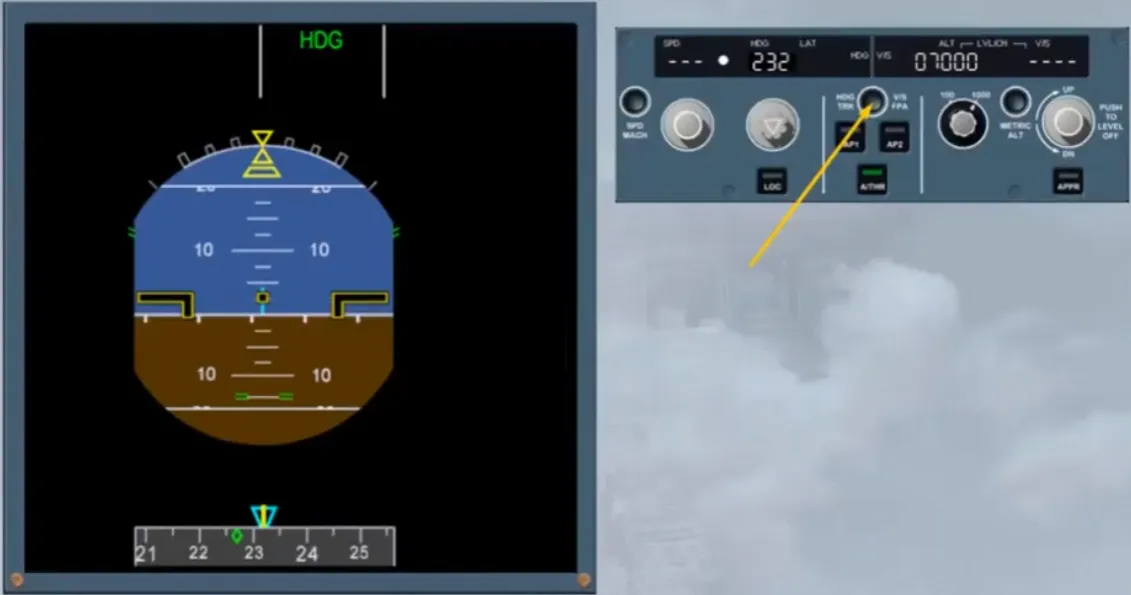
If the climb must be stopped, the V/S knob must be pushed.
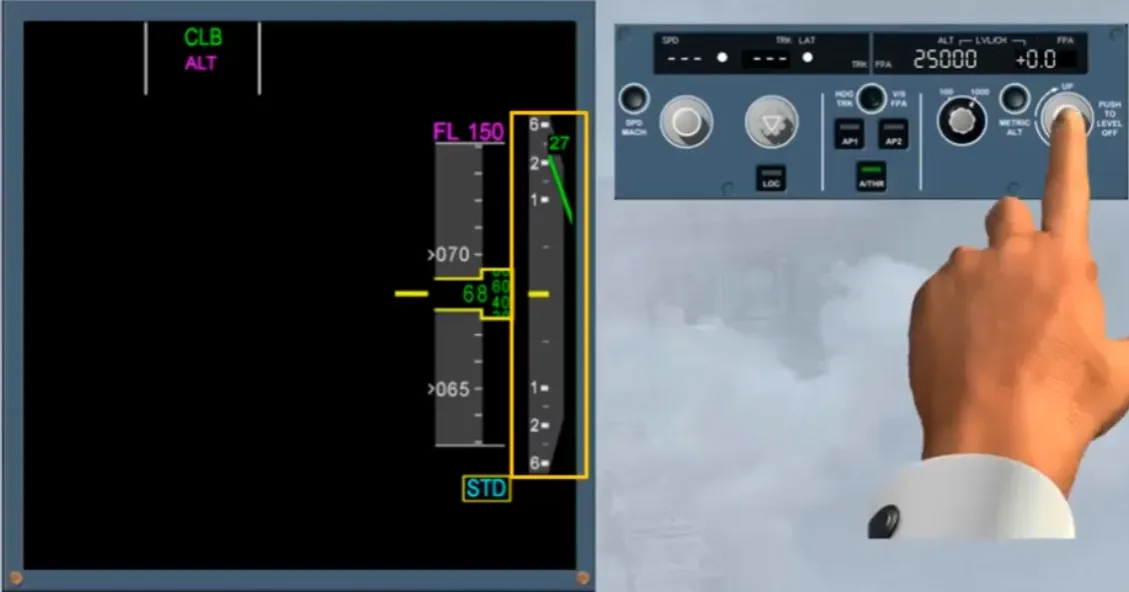
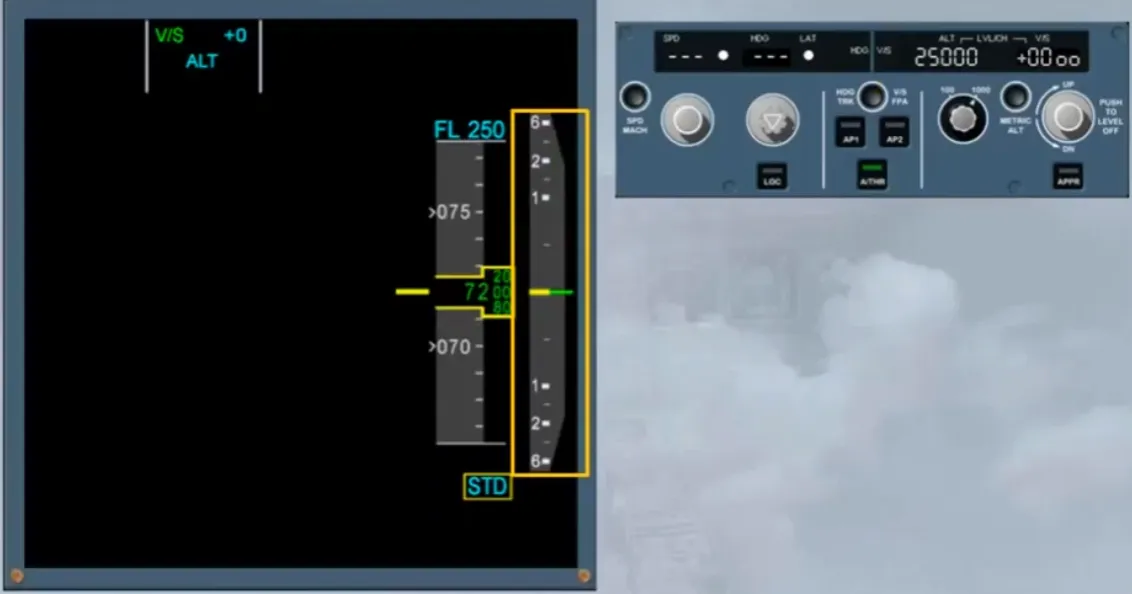
The target is shown on the FMA and can be FPA or V/S according to the selection done by the HDG-V/STRACK-FPA pb.
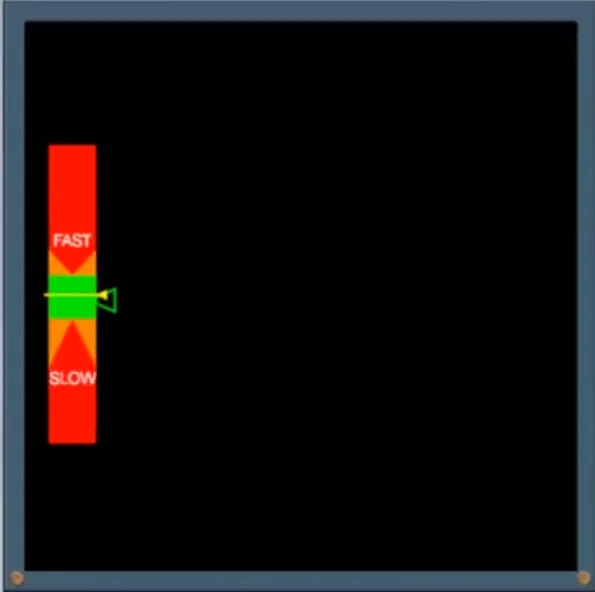
When the vertical speed reaches 0, orders are given to maintain it.
Note: The constraints are disregarded.
If the V/S-FPA knob is pulled, the current FPA or V/S is displayed on the FMA and on the FCU.
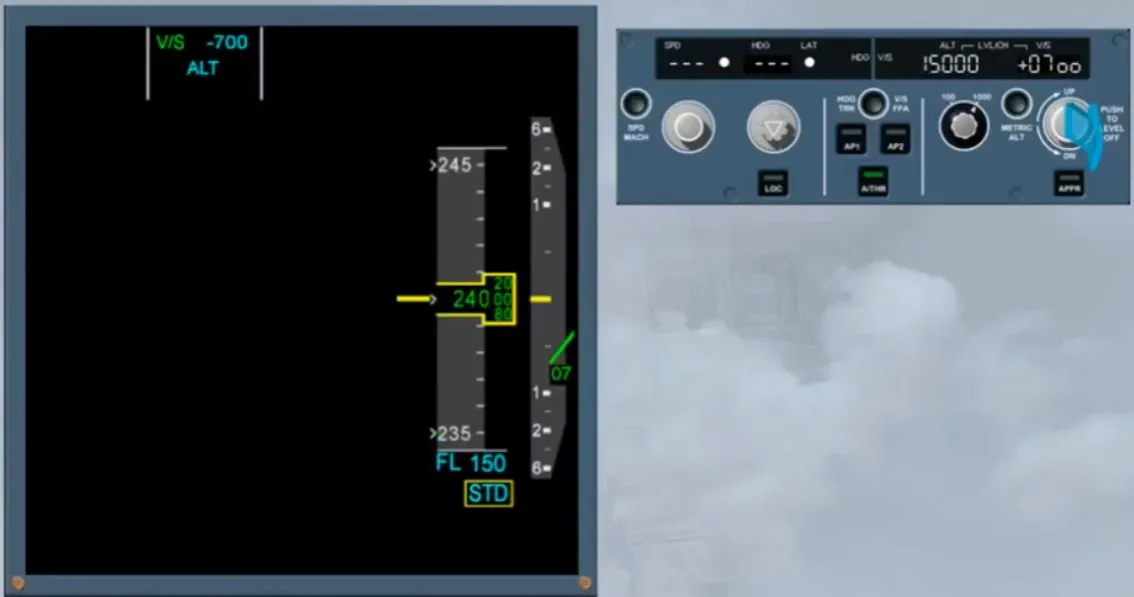
On the PFD, If the vertical speed is too excessive, the vertical speed indications change to amber. For more information refer to your documentation.
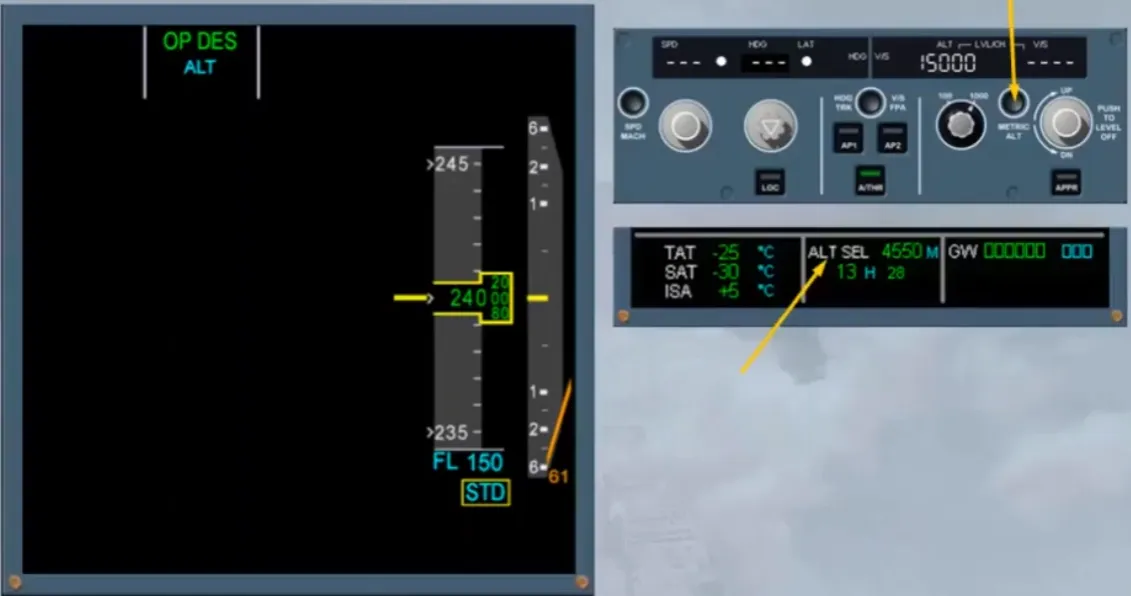
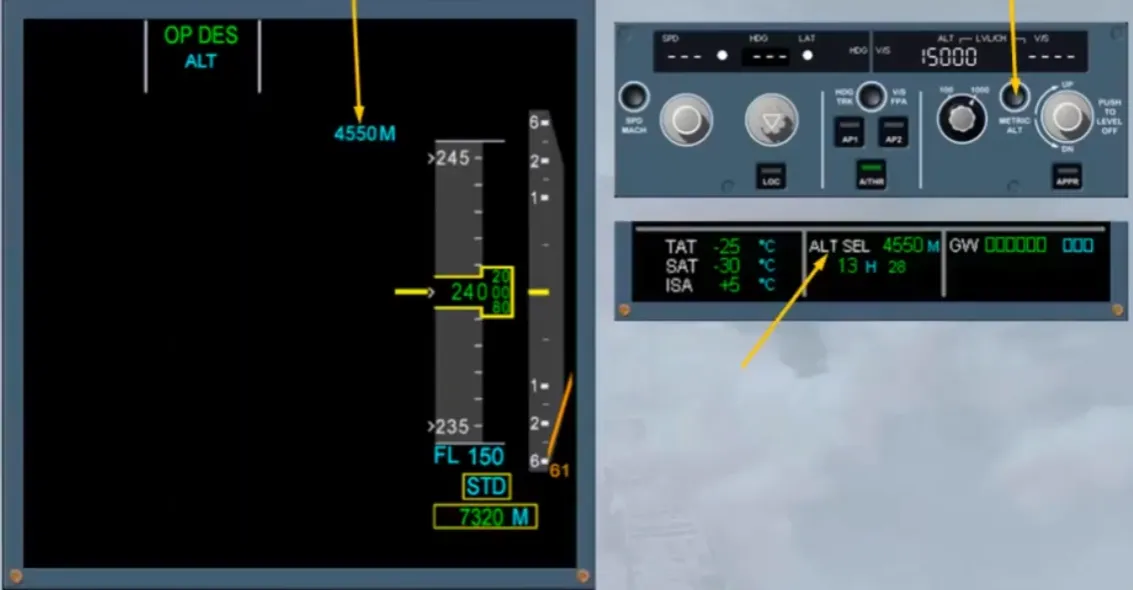
Note: If the METRIC ALT pb has been pressed, the selected altitude in meters will be displayed at the bottom of the SD.
Also, as an option on the PFD, the selected altitude and the current altitude in meters can be displayed.
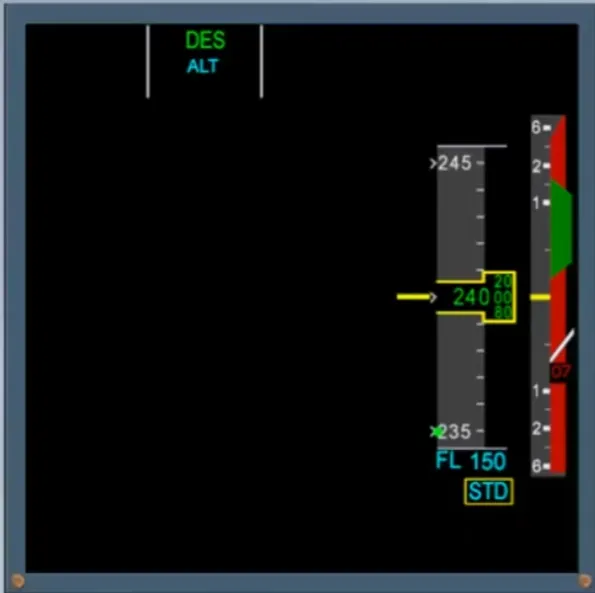
When there is a TCAS resolution advisory detection, the vertical speed scale becomes rectangular and orders to fly the green are displayed as shown. For more information, refer to the ATA 34, TCAS PRESENTATION module.
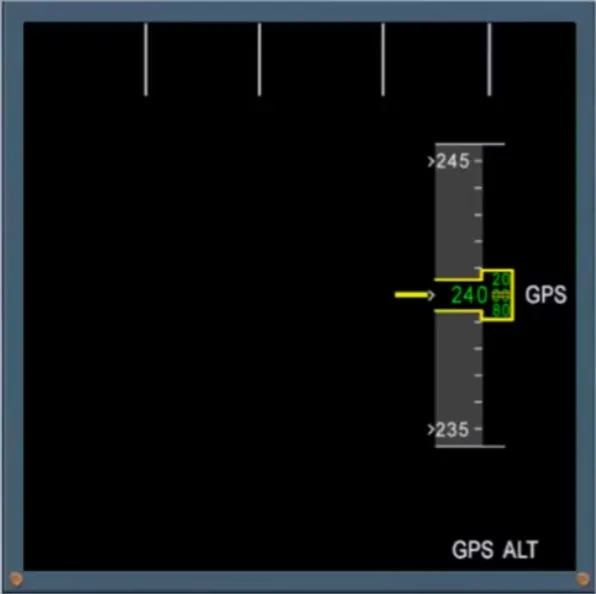
When the three ADR have been switched off, a backup altitude scale is shown. For more information, refer to the ATA 34, ADIRS PRESENTATION module.
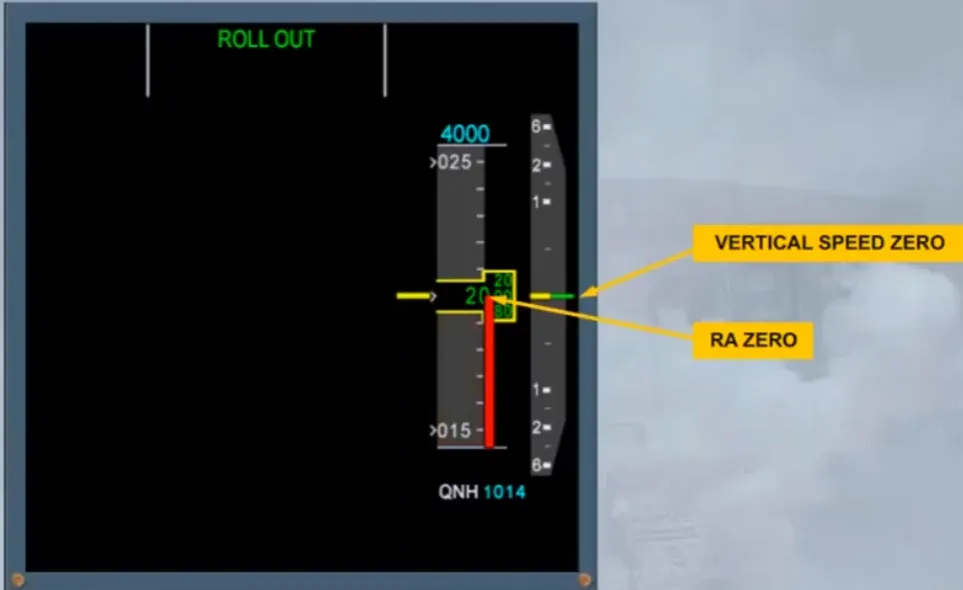
When the aircraft lands, the vertical digital indication disappears when it is less than 200 ft/min.
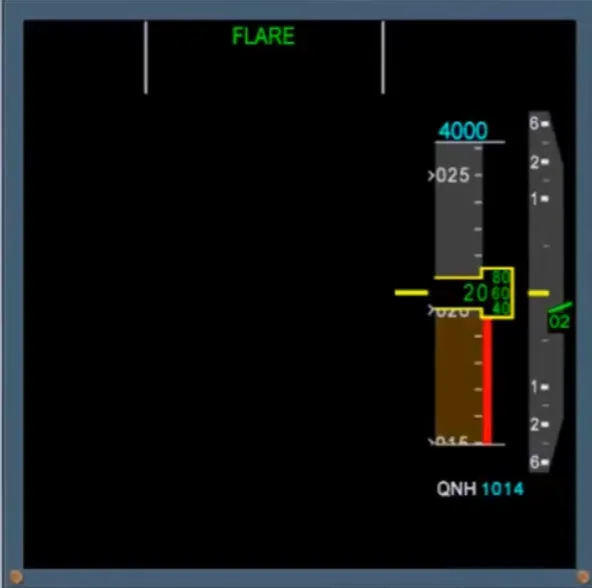
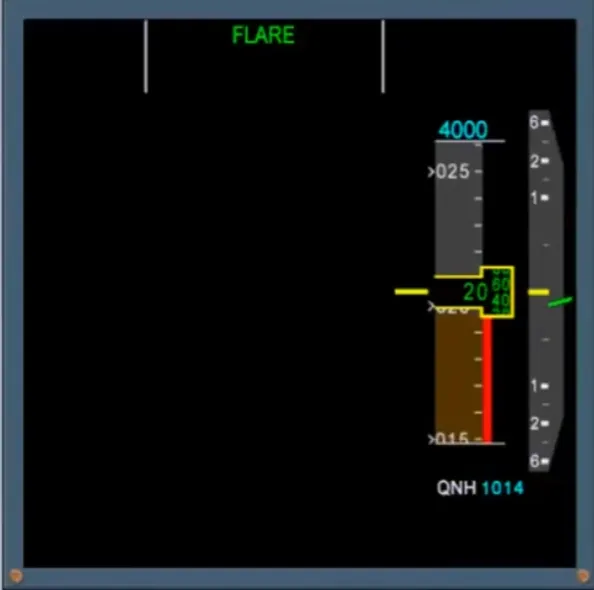
When the aircraft is on ground, the red ribbon is in the middle of the scale and the vertical speed needle is at zero.
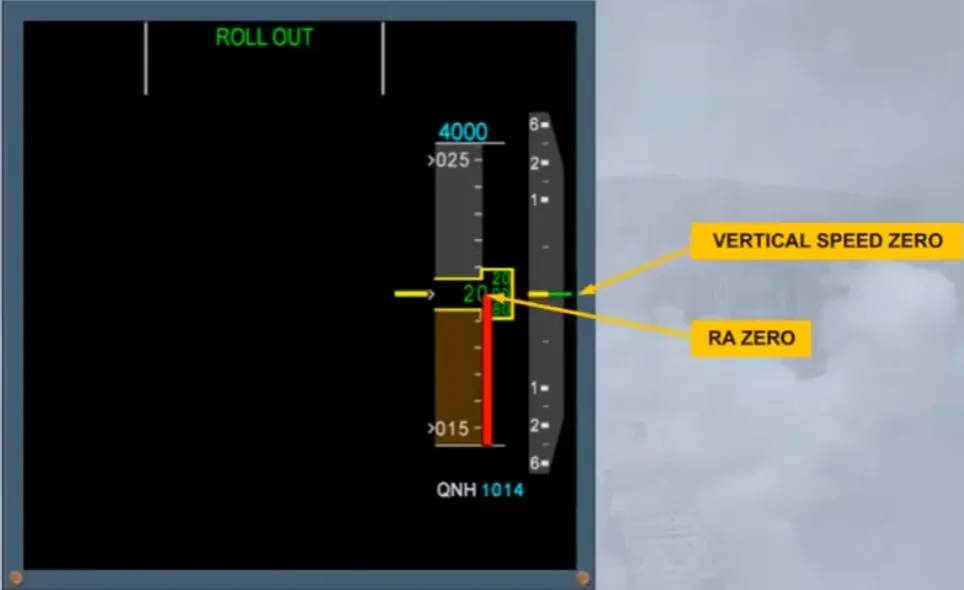
Note: The brown ribbon will disappear when the speed is below 80 knots.
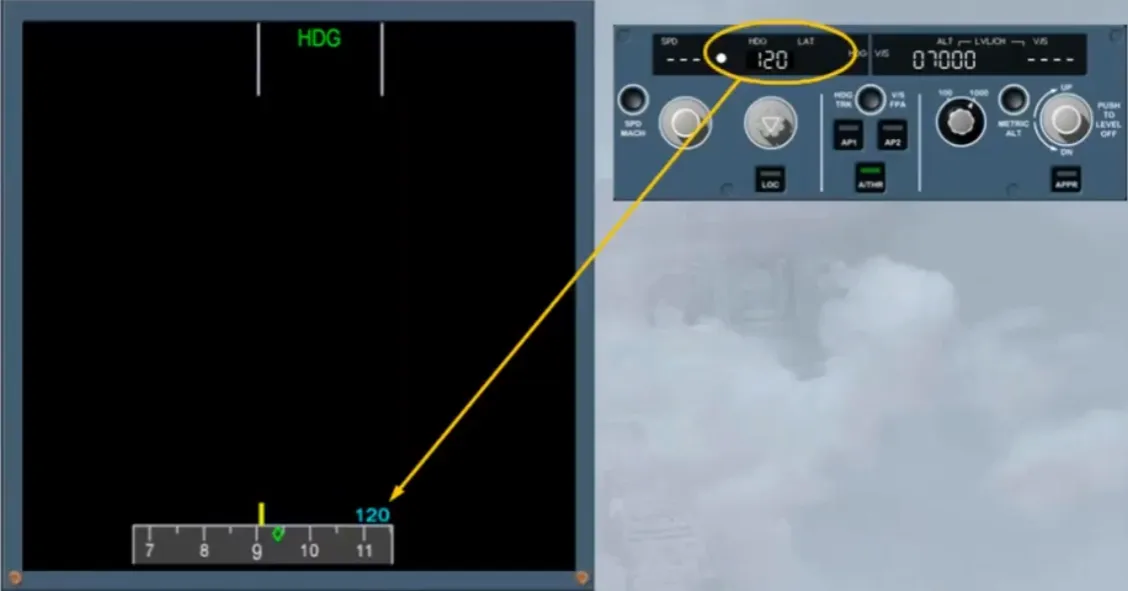
We will now look at the heading scale.
The heading scale displays a conventional compass.
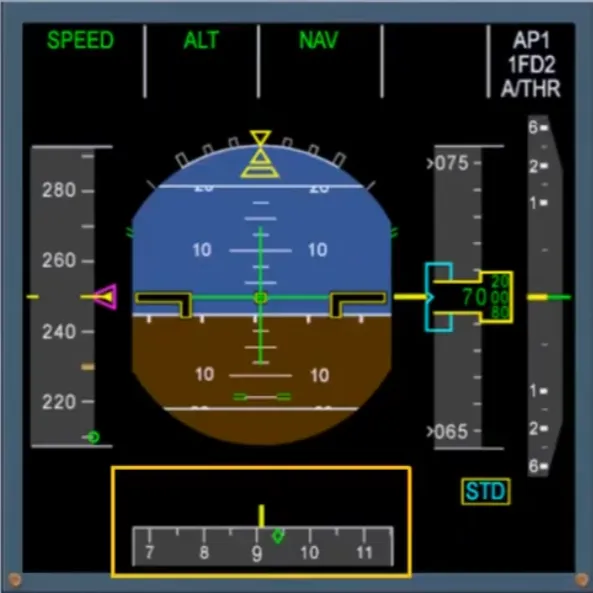
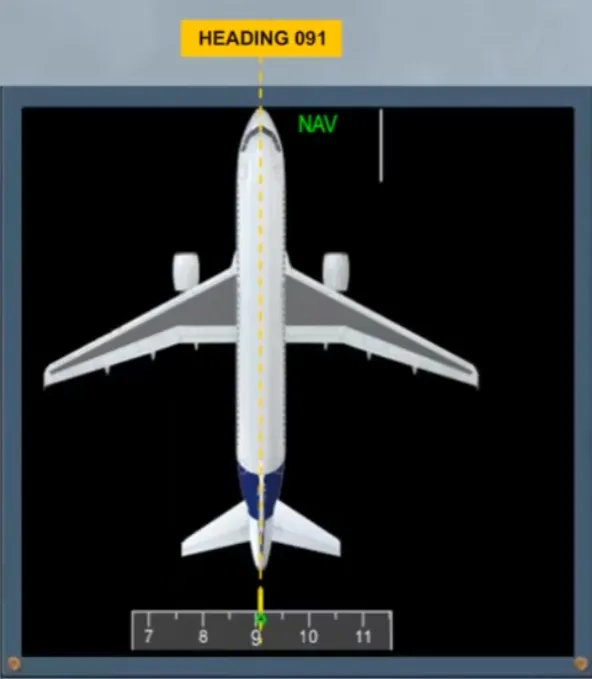
The gray scale moves against a fixed yellow line which represents the centerline of the aircraft. In the example shown, the aircraft is heading 091 degrees.
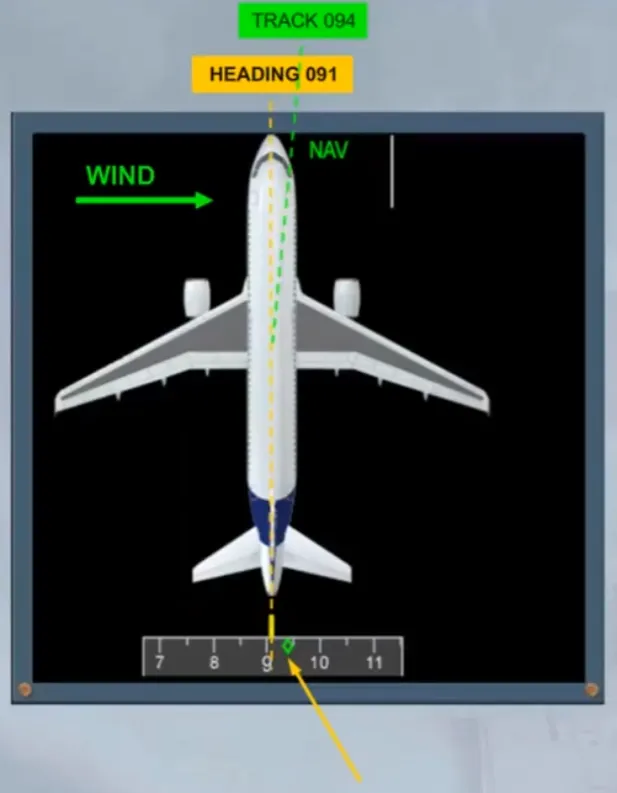
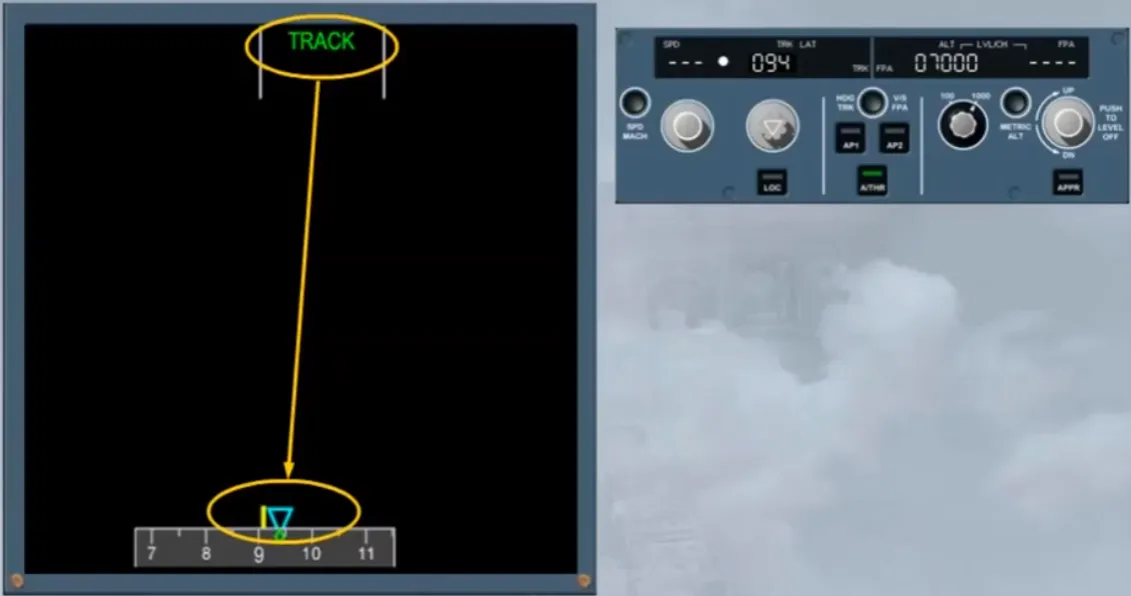
The small green diamond represents the aircraft track, and is normally referred to as the TRACK diamond.
In the example shown, the track is 094 degrees which means that the aircraft has 3 degrees of drift to the right.
A selected lateral target will appear if the related knob is pulled. It can be displayed by:
- A blue triangle, which is positioned:
- On the actual heading in HDG mode, or
- On the actual track if in TRACK mode.
- A blue figure, on the appropriate side of the compass scale if the FCU selection is out of view on the scale.

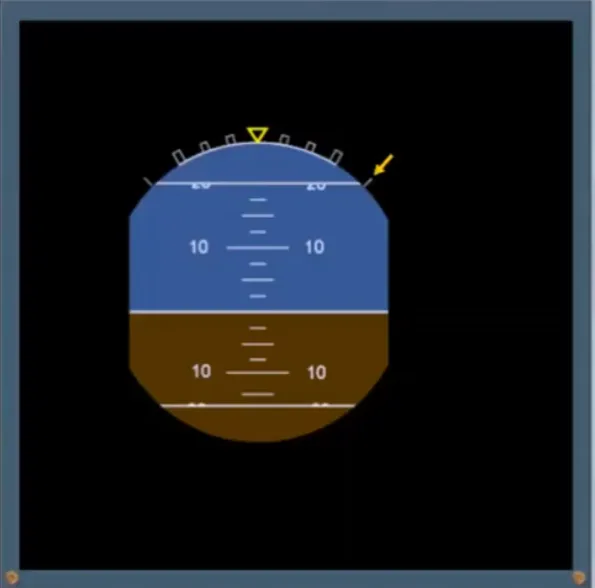
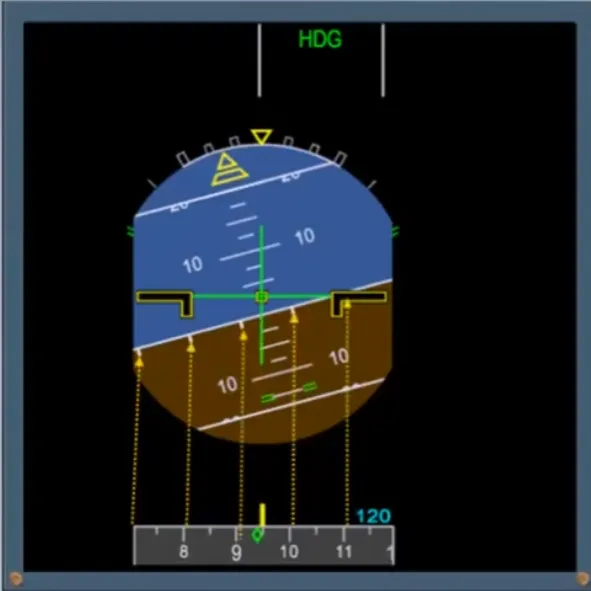
There is a direct relationship between the heading scale and the small white ticks on the horizon line of the attitude indicator.
As the heading changes the ticks move to stay in line.
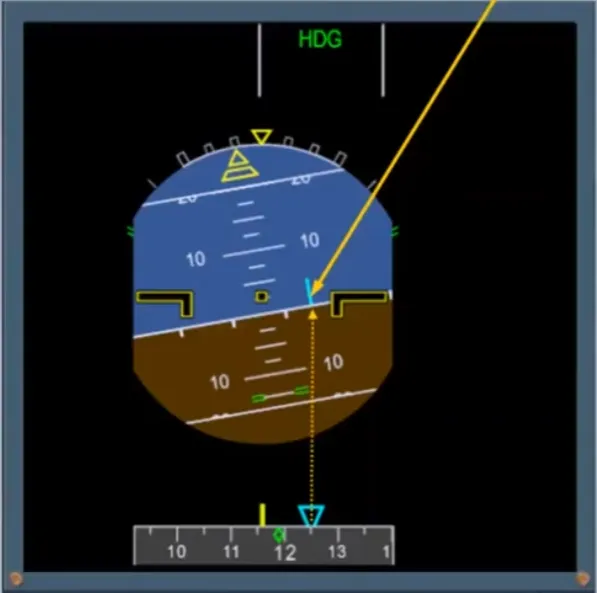
If the FD bars are removed, a blue line appears on the horizon line indicating the selected heading or track.
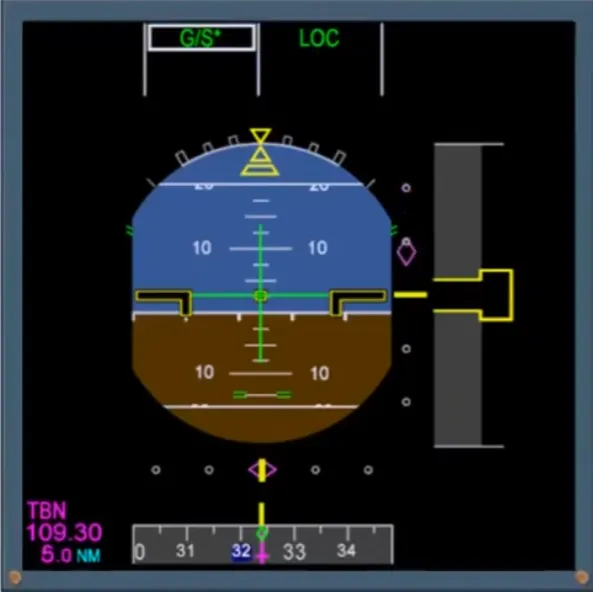
Now let’s look at how ILS information is displayed and in particular concentrate on the compass scale.
When the APPR has been selected, an amber ILS indication flashes on the PFD as long as the LS pb is not pressed on the EFIS control panel.
Notice that the lateral and vertical deviation indication scales and the ILS information are now displayed.
Note: if the tuned ILS has a DME, the related distance is also shown.
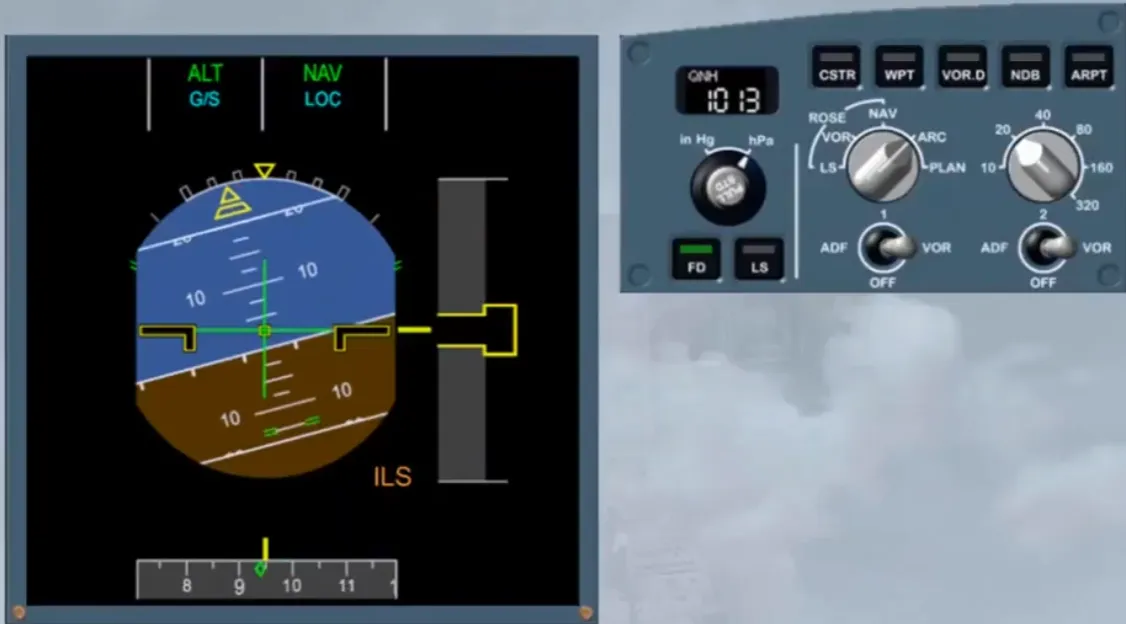
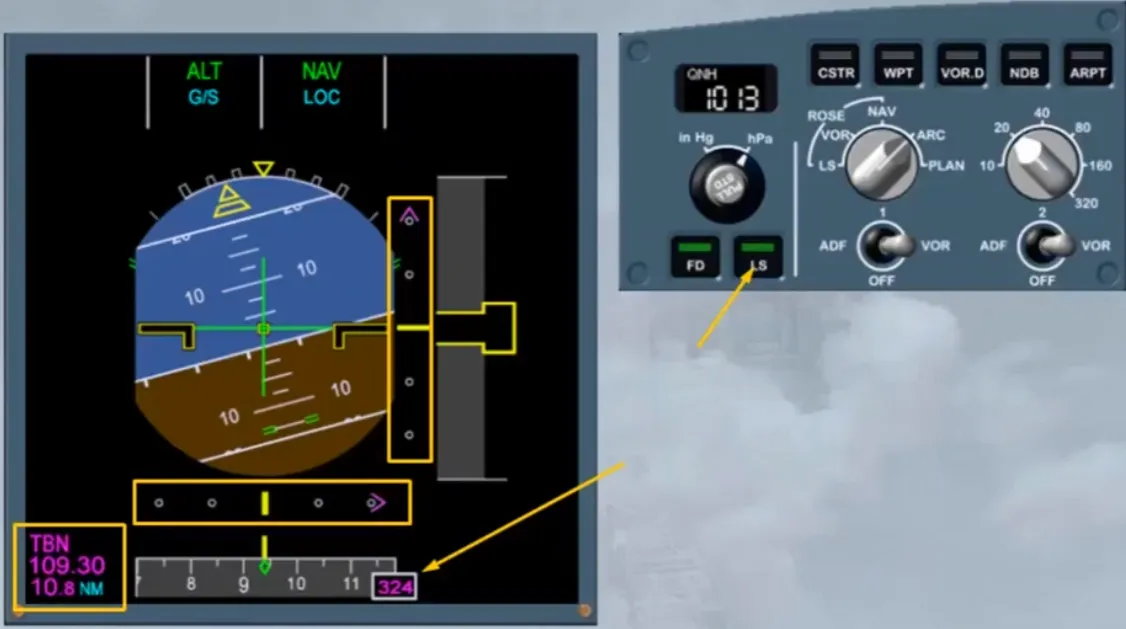
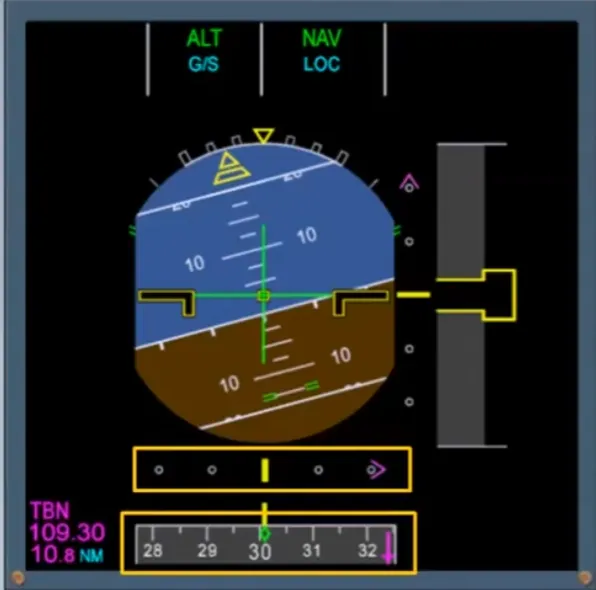
A magenta diamond represents the localizer.
When the ILS front course is within the compass scale, it is displayed as a magenta dagger.
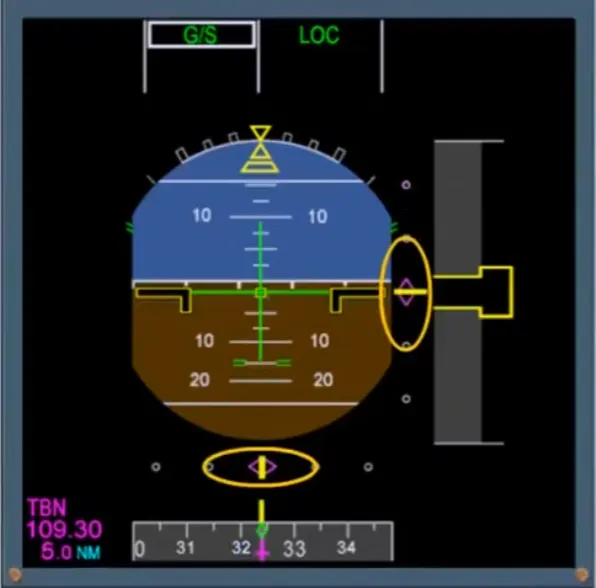
In the example shown, the aircraft is established on the localizer and the glide slope indication has appeared in the form of a magenta diamond.
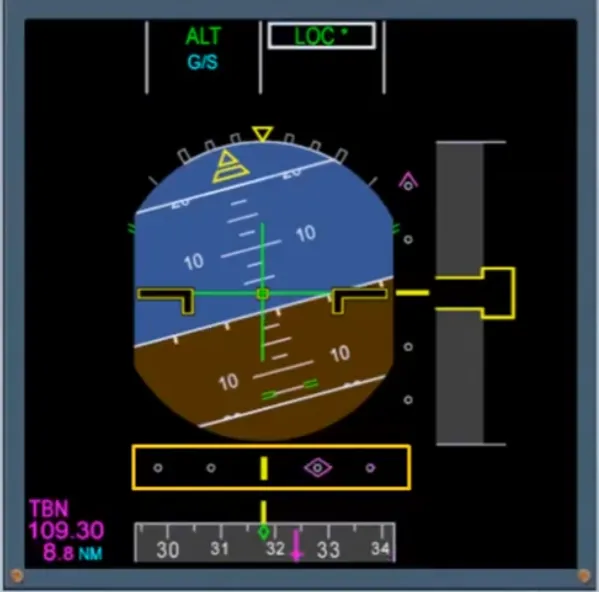
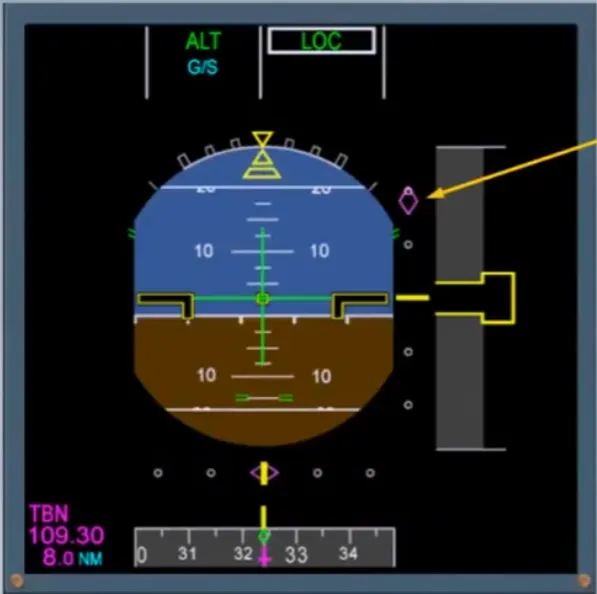
The aircraft is now fully established on the ILS approach.
You will be given more information on the ILS system, the Flight Director, the Radio Altimeter, and the Flight Mode Annunciator indications later in the course.
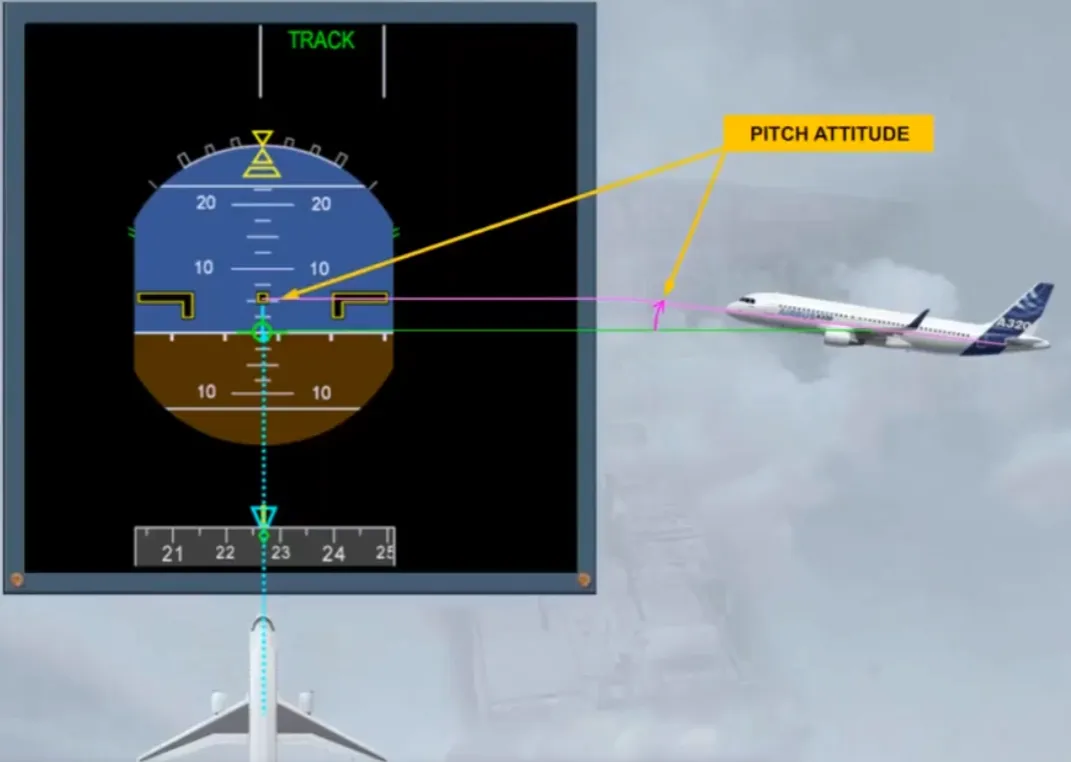
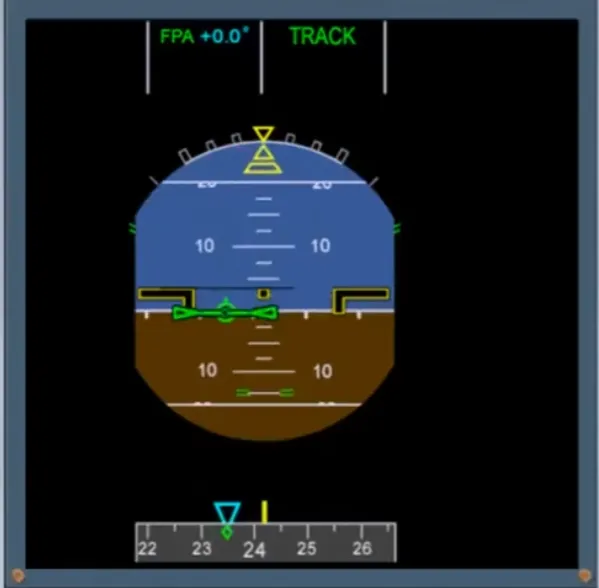
Now let’s look at another useful indication available on the PFD, the Flight Path Vector (FPV), called the bird.
The FPV can be displayed on the PFD by pushing the TRK - FPA button on the FCU. It shows you what the aircraft is doing in relation to the world. It is an indication of the aircraft flight path. It is not a director.
The green symbol, sometimes called “the bird”, represents the aircraft. The attitude indicator represents the world.
Let’s look at the FPV in a bit more detail.

When the aircraft heading and track are the same, the FPV and the track diamond are in line with the heading marker. So, these indications mean that the aircraft is not drifting.
As the aircraft is flying level, the FPV is on the horizon line. So, the flight path angle is zero with a pitch attitude of 5.1°.
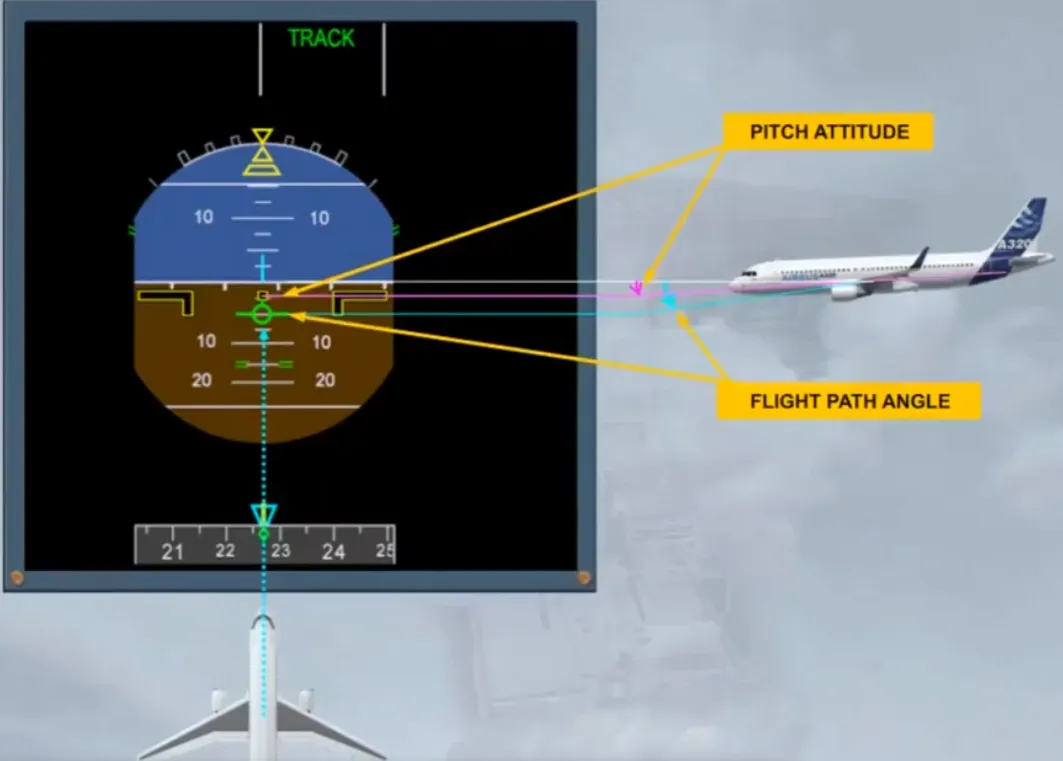
When the aircraft descends, the FPV is positioned on the related flight path angle, as shown here, on -5°.
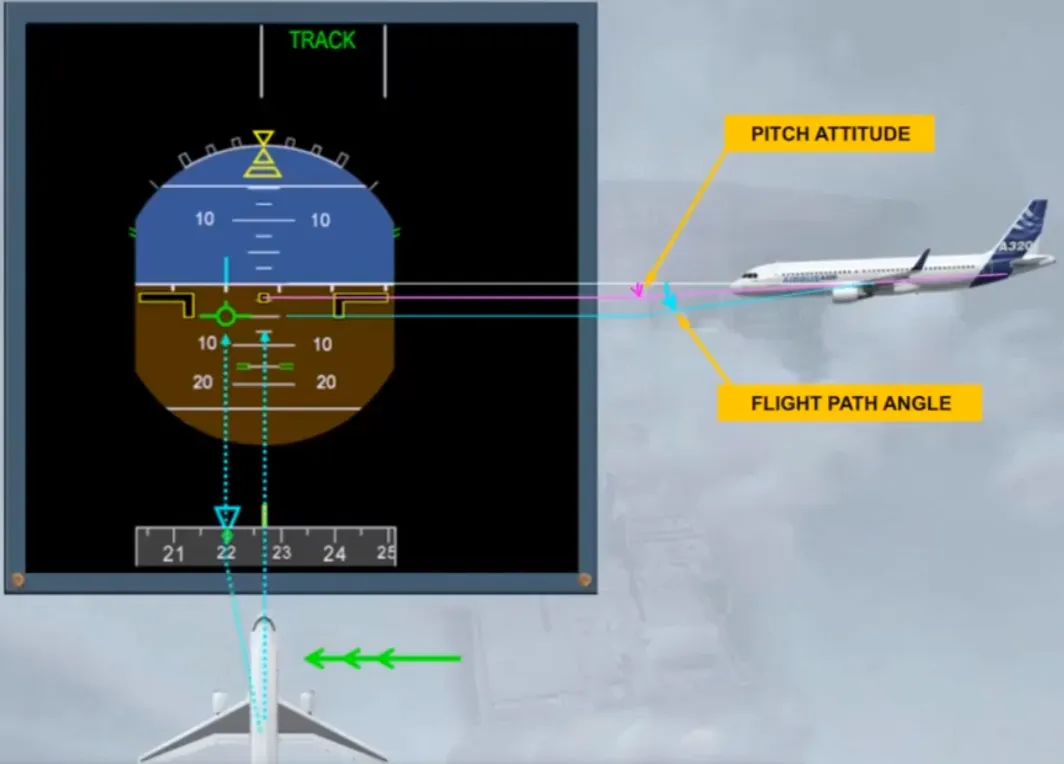
As a result of wind from the right, the aircraft is drifting to the left. So, the FPV is positioned on the related track, as shown here, on 220°.
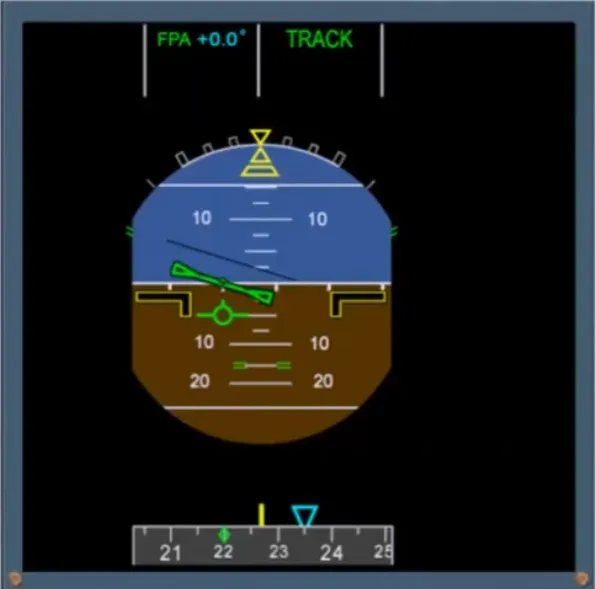
If the FD is on, the related orders are shown for the selected track and the selected FPA. Here, a right turn to track 235 with a FPA at 0.
Module completed
Video study
Section titled “Video study”- Watch the video available on YouTube